


A ticket lands: “the partner call is cut off halfway through in the logs”. You open the record and it simply stops. The payload crossed a limit somewhere. Large log records in Dynatrace raise exactly this operational question: how big can a record be, and on which path?
This article starts from that decision (keep, split or shrink a record) and checks every figure against the official documentation, read on 12 November 2026. It applies to Dynatrace SaaS (Grail and OpenPipeline). I did not verify Dynatrace Managed limits for this piece, so I quote none.
If cost is a new topic for you, read log costs: ingest, retain and query first.
The typical case: a record of several hundred kilobytes
A billing XML message, a partner API’s JSON response, a stack trace with its full context: such events quickly grow past a kilobyte. The vendor’s post puts this range between a few hundred kilobytes and several megabytes. For a long time the default answer was to truncate or split upstream, at the price of lost context.
The same post announces native support for single log events of up to 10 MB, with no configuration, through OneAgent, OpenTelemetry, the API or other collectors. It is vendor presentation material: it does not say what happens above 10 MB. The reference documentation spells out the conditions.
Large log records in Dynatrace: the limits to check
The Log Management and Analytics default limits page gives these values:
- Log entry body (content): 10 MB, but only 512 kB for logs processed by the Classic pipeline.
- API request: 10 MB at the endpoint; a batch above 16 MB after preprocessing is rejected with HTTP 413.
- Records per request: 50,000.
- Attributes: 500 per log, attribute value capped at 32 kB, key at 100 bytes, 5 levels of nested objects.
- Size after processing in OpenPipeline: 16 MB, according to the OpenPipeline limits page.
Keep the first line in mind: “10 MB” is not a universal promise. The Classic path stays at 512 kB. If a long log vanishes or stops short, check which pipeline it goes through first.
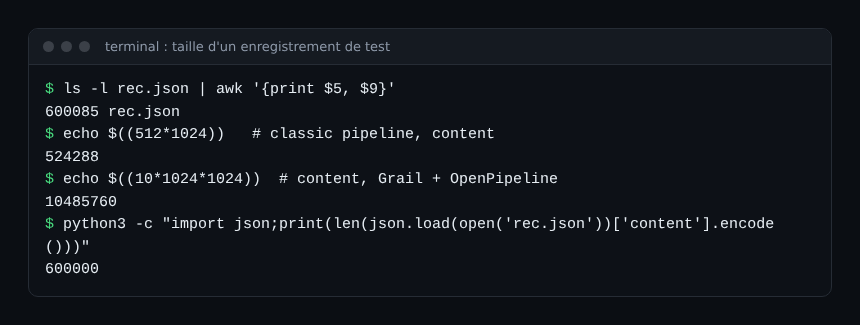
This capture is the real output of commands run on a test file. The 600,000-byte record exceeds the Classic limit but stays far below 10 MB.
Send a big record and check its size
Here is how to test on a pre-production environment.
- Create an API token with the log ingest scope and keep it in an environment variable.
- Build a JSON file with a large
contentfield. - Send it with
curlto the ingest API and note the status code. - Query the logs in DQL to measure the length of the content received.
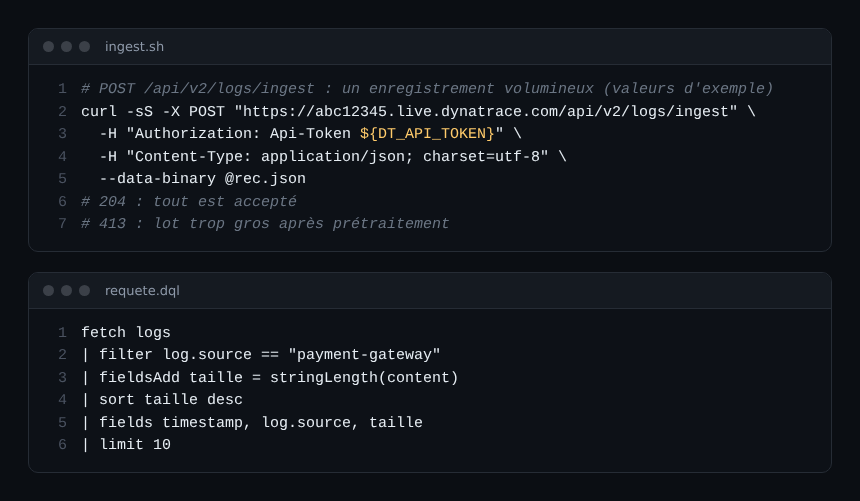
fetch logs
| filter log.source == "payment-gateway"
| fieldsAdd size = stringLength(content)
| sort size desc
| limit 10
A 204 means everything was accepted. The documentation also lists 400 or 200 depending on whether all or some events fall outside the accepted time range. If the measured size is below what you sent, a limit cut the content: go back to the list above. For syntax, see log pattern analysis.
What to do with a huge log once ingested
A multi-megabyte record costs storage, queries and reading time. Ask three questions in this order:
- Who reads it? If nobody reads the whole body, extract the useful fields (error code, order ID) and keep the rest for investigations.
- Which part is sensitive? A big JSON often hides personal data. See masking in OpenPipeline.
- Which pipeline fits? Route these logs to a dedicated pipeline with its own rules: create and route a pipeline.
Watch two processing limits. An extracted attribute is truncated to 4,096 characters when added to the event template. Each DQL processor script is limited to 8,192 characters, according to the OpenPipeline limits page.
Best practices
- Measure the real size of your biggest events before changing anything.
- Confirm the pipeline (Classic or OpenPipeline) of every source that produces big logs.
- Do not use logs to carry files: a log is an event, not storage.
- Extract useful fields at ingest and drop the rest when you can.
- Test a send above the limit in pre-production to learn the real behaviour: the documentation I read does not describe it for every path.
Frequently asked questions
What is the maximum log size in Dynatrace?
According to the SaaS documentation, an entry body can reach 10 MB, but only 512 kB on the Classic pipeline. Check the limits page before committing, as it changes.
Should I split large logs before sending them?
Not necessarily on the 10 MB path, according to the vendor’s post. On the Classic pipeline the 512 kB limit still applies. Measure with the DQL query above.
Does this apply to Dynatrace Managed?
This article covers SaaS only. For Managed, read the Managed documentation and do not reuse these figures.
Conclusion
Large log records in Dynatrace pass up to 10 MB on the Grail path, but the Classic pipeline cuts at 512 kB: the incident at the top often comes down to that detail. Measure, route, extract. Sources: Log Management and Analytics default limits, OpenPipeline limits, and the vendor post on large log records.
span.observer is an independent community blog, not affiliated with Dynatrace LLC. Brands mentioned belong to their owners. Limits change: check them in the official documentation.