

Your slow trace says a 900 ms span spent its time “inside the payment service”, and that is all. Continuous profiling answers the next question: which function, which line, burned that CPU time? Two open source tools compete here, Grafana Pyroscope and Parca. This article starts from the decision you face in operations, not from a tour of their screens.
The facts come from the two projects’ GitHub pages and official documentation, read on 11 November 2026. I installed neither tool for this article, and anything I could not verify is flagged as such.
If traces are new to you, start with the anatomy of an OpenTelemetry span. A profile complements the span: the trace tells you where, the profile tells you why.
The problem: a trace tells you where, not why
A trace splits a request into spans. It points at the slow link but not at the guilty code. To dig further, teams add logs, then manual spans, then redeploy. Every round costs on-call time.
A profiler samples the call stack at a regular interval. The more often a function shows up in the samples, the more it consumes. Drawn as a flame graph, the result is readable at a glance. “Continuous” means the sampling runs all the time in production, not only during an investigation. When the incident hits, the profile already exists.
Continuous profiling: choosing between Pyroscope and Parca
Here is what the repositories say, without jumping to conclusions:
- Grafana Pyroscope: AGPL-3.0 licence, about 11,700 stars on the repository page. It calls itself a “continuous profiling platform” that helps debug performance down to a single line of code. Profiles arrive through Grafana Alloy (pull or push), through SDKs (Go, Java, Python, Ruby, Node.js, .NET, Rust) or over OTLP from the OpenTelemetry eBPF profiler.
- Parca: Apache 2.0 licence, about 5,000 stars. It offers a server that stores and queries profiles over time, and Parca Agent, a whole-system eBPF profiler. The repository page lists C, C++, Rust and Go for the agent.
The GitHub pages I read did not show the latest commit date or release versions, so check those yourself before choosing. The choice comes down to two questions.
- Do you need the trace-to-profile link? Pyroscope’s documentation describes “span profiles” for Go, Java, Ruby, .NET and Python. In the Parca pages I read, trace correlation is not described, so I do not claim it.
- Which licence will your company accept? AGPL-3.0 carries obligations if you modify the server and offer it over a network. Apache 2.0 is more permissive. Ask your legal team.
From slow span to profile: how the link works
The mechanism Pyroscope documents is simple. Each profile sample carries labels: span_id identifies the span active when the sample was taken, and trace_id the trace that contains it. A span that can have a profile carries the pyroscope.profile.id attribute, whose value is the span ID. Grafana uses it to offer the jump from a span to its profile.
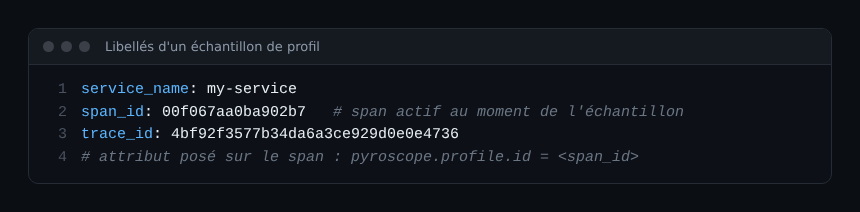
For Grafana to find the trace and profile pair, the documentation asks you to configure the Tempo data source in Grafana. It points to a “Traces to profiles” page for details, which I did not re-read. To set up Tempo, see our article on Grafana Tempo with kube-prometheus-stack.
Steps: instrumenting a Go service
This is the official documentation’s Go example. It assumes you already have an OpenTelemetry tracer provider (tp) and a Pyroscope server on port 4040.
- Install the module:
go get github.com/grafana/otel-profiling-go. - Start the Pyroscope SDK when the process launches.
- Wrap your tracer provider with
otelpyroscope.NewTracerProvider.
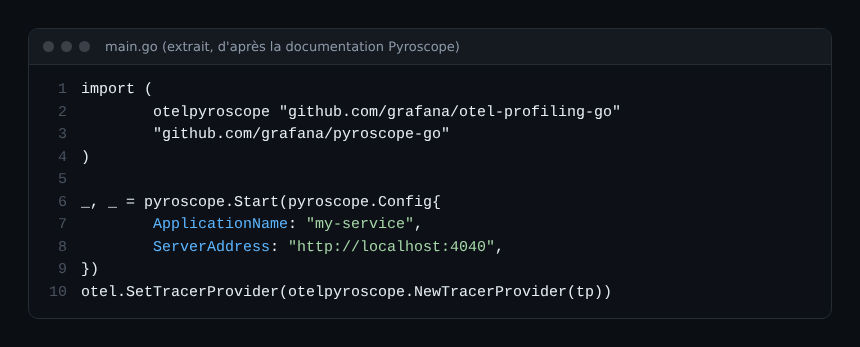
The critical point is step three: without the wrapper, profiles exist but carry no span_id, so the jump from the trace is impossible. Replace my-service and the address with your own values.
What the link does not guarantee
The documentation is explicit about limits. These matter most on call:
- By default only the local root span is labelled. Its profile includes the samples from its child spans. Go and Java can label every span.
- The
pyroscope.profile.idattribute does not guarantee that samples exist. - The profiler samples, so a very short span may have no samples, and a span with few samples can mislead.
- Avoid dynamic span names (URLs, SQL): they hurt performance.
In practice, use the profile to confirm a hypothesis on long spans, not to explain a 2 ms span. For the difference between correlation identifiers, also read correlation ID or trace ID.
Parca and eBPF: profiling without touching the code
If your services are in C, C++, Rust or Go and you would rather not change the code, the eBPF approach is attractive. Parca Agent discovers targets from Kubernetes or systemd and pushes profiles to the server. Parca’s documentation describes purpose-built storage where each series is identified by its label combination, which lets you compare profiles across processes or code versions.
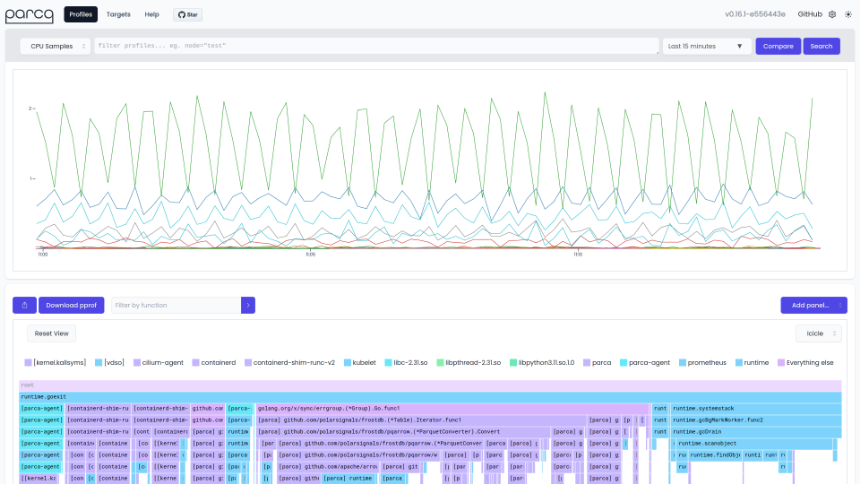
The screenshot, from the Apache 2.0 repository, shows the consumption chart followed by the inverted flame graph (icicle). To understand what eBPF changes for operations, see eBPF and Cilium on Kubernetes.
OpenTelemetry and profiles: where do things stand?
OpenTelemetry is working on a “profiles” signal. According to the official blog announcement it entered public alpha and “should not be used for critical production workloads”. The post also notes that production-ready backends had not emerged yet, with Beta and GA as the next milestones. I could not find the announcement date, so check the current status before committing.
In practice, do not wait for the standard to start. Pyroscope already accepts OTLP from the OpenTelemetry eBPF profiler, according to its README.
Best practices
- Start with one critical service, not the whole fleet.
- Keep span names stable and few.
- Measure the profiler’s overhead in pre-production before enabling it in production: I have no verified figure to give you.
- Write it into the runbook: “slow span, open the span’s profile, look for the widest function”.
- Record the chosen licence and the date you checked it.
Frequently asked questions
What is the difference between continuous profiling and tracing?
A trace measures time spent per request step. A profile samples call stacks and shows which functions use CPU or memory. They complement each other.
Pyroscope or Parca: which one?
If you want to jump from a span to its profile in Grafana, Pyroscope’s documentation describes it. If eBPF without code changes and the Apache 2.0 licence matter most, Parca deserves a trial. Test both on one service before deciding.
What about Dynatrace?
This article covers third-party open source tools only. For what Dynatrace offers in this area, consult docs.dynatrace.com, keeping SaaS and Managed apart: I mix none of its features in here.
Conclusion
Continuous profiling turns “the span is slow” into “this function is guilty”, provided you link profiles to traces. Choose on licence, trace link and language. Sources: Pyroscope documentation, Parca documentation.
span.observer is an independent community blog, not affiliated with Dynatrace LLC, Grafana Labs or Parca. Brands mentioned belong to their owners. Tools change quickly: check commands and options against the official documentation.