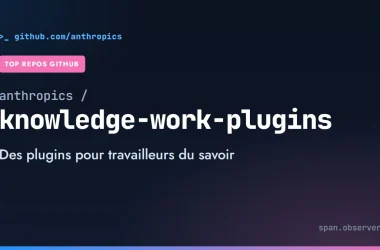

Should an AI agent be allowed to read your production logs and push a fix? That is the real question behind the OpenSRE SRE agent: the Tracer-Cloud/opensre repository, licensed Apache 2.0, showed about 12,800 stars on 11 November 2026, and its latest commit was dated the same day. The project is clearly active, yet it calls itself a “public alpha”.
This article starts from the operating decision rather than the feature list: what do you grant the agent, what may it read, and how do you monitor the agent in turn? The facts come from the README, the LICENSE file and the repository documentation, read on 11 November 2026.
A note on honesty: span.observer has not installed OpenSRE. The screenshots below come from the project’s repository (Apache 2.0). For the wider picture of what SRE agents promise, see our look at AIOps claims; for the Dynatrace side, the article on autonomous SRE agents.
The OpenSRE SRE agent: what the repository says
- Positioning: the README title calls it an “open-source agent for CI/CD reliability”. It reads a failed run, traces the cause and pushes a fix for you to review. The same README also describes alerts and plain-language questions about production.
- Licence: Apache 2.0 (the repository’s LICENSE file).
- Maturity: a banner says “Public Alpha”, with core workflows “usable for early exploration, though not yet fully stable”. No release was displayed when I read the page.
- Models: self-hosted, with your own models (Anthropic, OpenAI, Ollama, Gemini, OpenRouter, Bedrock and others in the README list). A hosted model tied to an OpenSRE account is also offered at first launch.
- Integrations: “60+ tools”, including Grafana, Datadog, CloudWatch, Sentry, Splunk, Kubernetes, PagerDuty, Slack and the MCP protocol.
I found no mention of Dynatrace in the repository. A connection might go through MCP, but I did not verify it, so do not assume it.
The operating decision: what scope to grant
Before installing anything, three choices set the risk.
- Where the model runs. Production logs go to an external provider, or stay in-house with Ollama. The README mentions optional masking of sensitive identifiers before model calls: turn it on, then check it against a set of fake logs.
- What it reads. One read-only token per source. The Grafana documentation asks for a service account token “with read access”.
- What it writes. Pushing to a pull request branch is an action a human reviews. Running remediation actions is “optional” according to the README: leave it off at the start.
It is the same reasoning as for an on-call agent wired to Dynatrace: negotiate the scope before the first demo, not after an incident.
A quick tour and installation
The README gives a one-line install that needs no sudo and fetches the latest build of the main branch. On macOS or Linux:
curl -fsSL https://install.opensre.com | bash -s -- -gh
opensre
On Windows the README provides a PowerShell equivalent. Piping a remote script into bash calls for care: read install.sh in the repository before running it, and try it on a disposable machine.
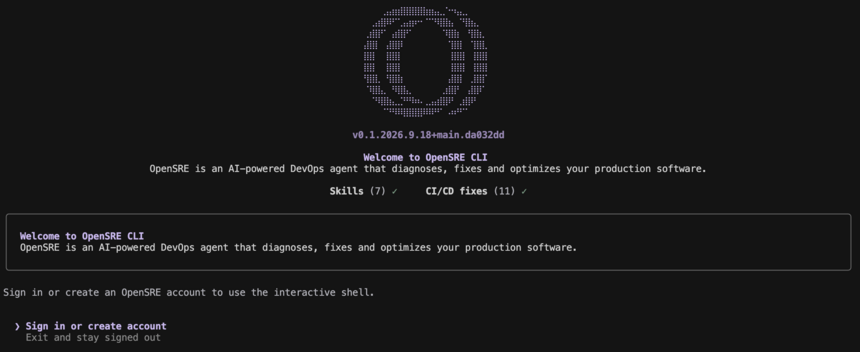
The screenshot shows the welcome screen: on first run, the interactive shell asks you to sign in, create an account, or stay signed out. The README states that the shell only opens for an active account.
Connecting an observability source
Integrations are set up with opensre integrations setup. For Grafana, the documentation offers four routes: the interactive wizard, environment variables, a persistent store or, later, the hosted web app, which is marked “coming soon”.
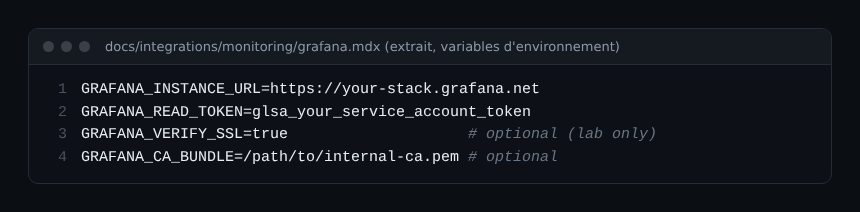
Two details matter for security. First, GRAFANA_VERIFY_SSL=false is for labs only; for an internal instance the documentation recommends supplying a certificate authority bundle. Second, the token in the screenshot is a placeholder: keep yours in a secrets manager, never in a repository.
Asking the agent from a script
The opensre ask command runs a single agent turn, prints the answer and exits. Each run is saved as a resumable session unless you pass --ephemeral.
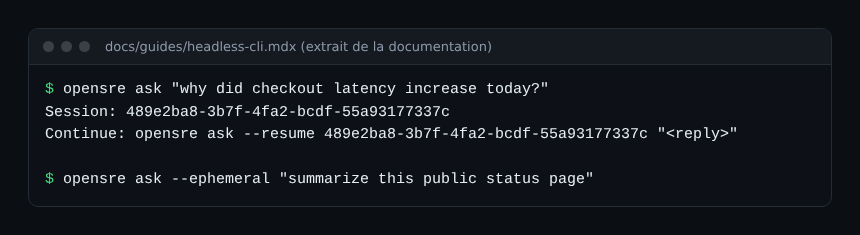
If the agent needs a decision, it exits with the status needs_input and offers numbered options. In a script or a CI job that is a useful stopping point: a human stays in the loop. JSON output and stdin input are described on the “Headless CLI” page.
Monitoring the agent itself
An agent that reads your production becomes a production component. According to the documentation, four things can be measured or configured:
- Project telemetry: product analytics and Sentry error reports are on by default (opt-out).
export OPENSRE_NO_TELEMETRY=1turns them off. - Prompt log:
OPENSRE_PROMPT_LOG_DISABLED=1disables it, including for ephemeral requests. - Cost and sessions: the shell offers
/costand/sessionscommands. I did not check what they display. - Silent failures: a confident but wrong answer raises no alert. Detecting silent AI agent failures covers what to measure.
The repository also contains a triage pilot for the OpenTelemetry demo payment service: OpenSRE reads metrics, traces and logs stored in ClickHouse, not the Collector. The distinction is useful: the agent consults a history, and replaces neither collection nor storage.
Limits and open questions
- Alpha: APIs and integrations may change, says the README.
- Main target: the current positioning is CI/CD reliability; production incident investigation is there, but I have not measured its quality.
- No quoted performance figures: the project mentions end-to-end tests in
tests/e2e, not a reproducible comparison I can report. - Data: without masking, your logs travel to the model you chose.
- An active repository is a moving one: the README notes the removal of older “graph and chain” layers. Documentation read today may age fast.
Best practices
- Start read-only, on a test environment and a single source.
- Keep automatic remediation off until you have reviewed ten investigations.
- Compare each conclusion from the agent with your own dashboards, as with any young open source project: the repository is not a guarantee.
- Decide who receives the Slack or PagerDuty summaries and who answers them.
Frequently asked questions
Is OpenSRE free and open source?
The code is under the Apache 2.0 licence. The models you call (paid APIs) and the optional hosted model of an OpenSRE account have their own terms, which I did not read.
Can it replace a human on-call rota?
Nothing in the README claims so: the agent offers an evidence-backed answer and a fix to review. The decision stays human, and the alpha status calls for caution.
Does it work with Dynatrace?
Dynatrace is not in the README’s integration list. MCP support leaves a door open that I did not verify. To compare, see the announcement of Dynatrace’s SRE agents.
Conclusion
OpenSRE deserves a supervised trial if you want a self-hosted agent wired to observability tools you already run. Set the scope first, read-only access and a model of your choice, then measure the agent as you would any service. Repository and documentation: Tracer-Cloud/opensre.
span.observer is an independent community blog, not affiliated with Dynatrace LLC or Tracer. Trademarks belong to their owners. Tools change quickly: check commands and options against the official documentation.