
Dynatrace key requests solve a classic on-call problem: the request that matters most to the business is not always the one that carries the most traffic. A /login or /cart/checkout may be a small fraction of a service’s throughput, so its degradations slip under the default alerting.
Marking a request as a key request gives it dedicated metrics, long history, guaranteed alerting even at low volume and, if needed, its own thresholds. For an SRE team, it is the most direct way to turn “the request that makes the money” into a monitored signal, then into an SLI.
This guide applies to Dynatrace Managed and to Dynatrace SaaS environments that still use classic services (Services Classic). Note: the documentation states that setting up key requests is not available for SaaS environments created in version 1.330 or later; we come back to this below.
What Dynatrace key requests change
A key request is a service request you declare important, either because it measures business success (login, payment) or because it provides technical functionality the application relies on. In practice, marking it gives you four things:
- Alerting always on. By default, a request contributing less than 1% of a service’s load does not raise alerts unless it degrades the whole service’s response time or failure rate. A key request keeps standard alerting thresholds whatever its volume.
- Its own thresholds. You can set response-time and failure-rate thresholds at request level; they then override the service-level ones.
- Dedicated metrics from the
builtin:service.keyRequest.*family, usable in Data Explorer, dashboards and SLOs. - Longer retention: detailed code-level data 10 days, aggregated code-level data 35 days, long-term metric history 5 years.
Key requests appear in the Key requests/endpoints section of each service page, instead of getting lost at the bottom of Top requests.
Limits to know before marking
- 500 key requests per environment, across all services;
- 100 key requests per service;
- dashboard tiles only include data collected after marking: no backfill;
- detection is name-based. A request naming rule that renames the request breaks the link unless you add the new name.
Beyond these limits, or for finer splitting, the documentation recommends calculated service metrics (see Multidimensional analysis in Managed).
Prerequisites
- A service detected by OneAgent, with traffic on the request you want to mark.
- For the UI: configuration access to the environment.
- For the API: an access token with the
settings.readandsettings.writescopes. - The service’s entity ID (
SERVICE-…format), obtained with theGET /api/v2/entitiesAPI: see how to find a Dynatrace entity ID.
In practice: mark a key request
Step 1 — Find the request in the UI
- Open Services (Managed) or Services Classic (SaaS).
- Select the service from the list.
- On the service page, select a View button (View requests, View dynamic requests or View resource requests).
- Scroll to Top requests and select the request.
Step 2 — Mark it
On the request page, open the More (…) menu and select Mark as key request. The Pin to dashboard option in the same menu also pins a request-specific tile to a classic dashboard.
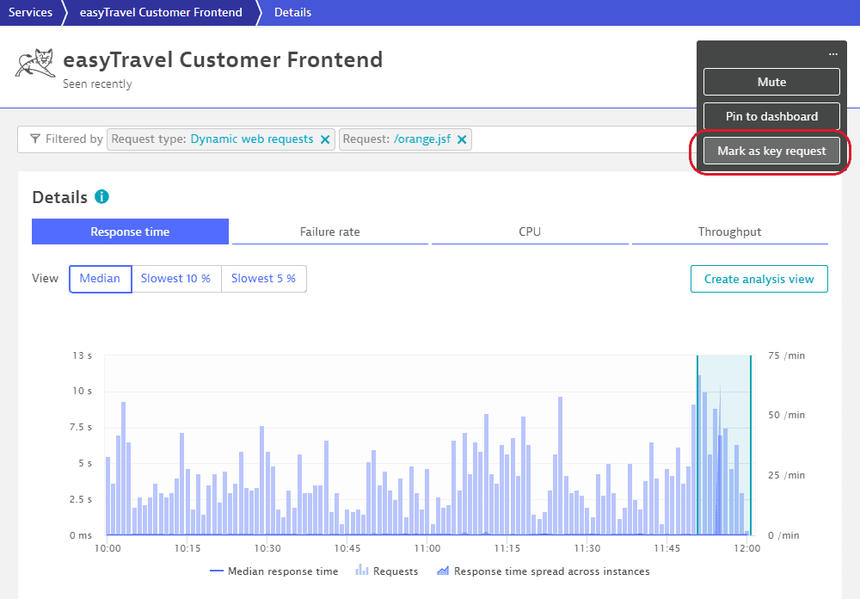
Once you manually mark a request, its trend lines are retained perpetually.
Step 3 — Protect the marking against renames
If you apply a request naming rule later, add the new name to the list: Services, select the service, More (…) > Settings, Key requests tab, then Add item. Without it, the renamed request is no longer recognised as a key request and its dedicated alerting silently disappears.
Step 4 — Automate with the Settings API
To version the list (and recreate it identically across environments), use the Settings API. The schema is builtin:settings.subscriptions.service and its scope is always a service, identified by its entity ID.
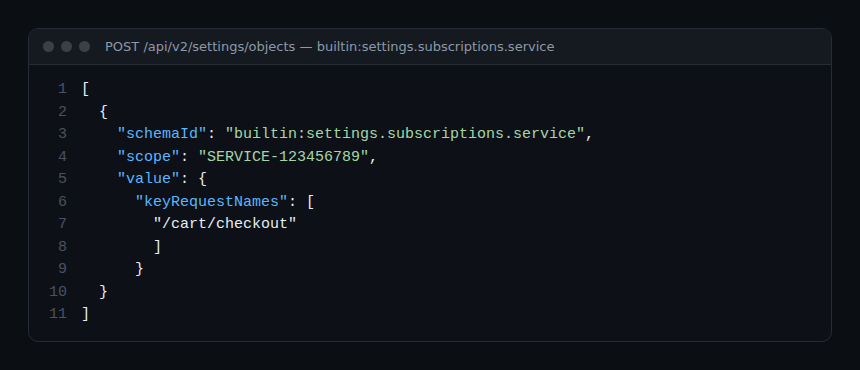
# Managed : https://{your-domain}/e/{your-environment-id}
# SaaS    : https://{your-environment-id}.live.dynatrace.com
curl -X POST "$DT_URL/api/v2/settings/objects" \
  -H "Authorization: Api-Token $DT_TOKEN" \
  -H "Content-Type: application/json" \
  -d '[{"schemaId":"builtin:settings.subscriptions.service",
        "scope":"SERVICE-123456789",
        "value":{"keyRequestNames":["/cart/checkout"]}}]'
Critical point: the documentation states that this creation overwrites the service’s existing configuration. To change a list that already exists, read the object first, take its objectId and updateToken, then send the full list with PUT:
curl -s "$DT_URL/api/v2/settings/objects?schemaIds=builtin:settings.subscriptions.service&scopes=SERVICE-123456789" \
  -H "Authorization: Api-Token $DT_TOKEN"

curl -X PUT "$DT_URL/api/v2/settings/objects/{objectId}" \
  -H "Authorization: Api-Token $DT_TOKEN" \
  -H "Content-Type: application/json" \
  -d '{"updateToken":"{updateToken}",
       "value":{"keyRequestNames":["/cart/checkout","/cart"]}}'
Using a key request day to day
Request-specific alert thresholds
The builtin:anomaly-detection.services schema accepts three scopes: SERVICE_METHOD (the request), SERVICE and HOST_GROUP. An object set at request level carries its own responseTime and failureRate settings, in auto or fixed mode. This is useful for a payment bound by a strict contractual commitment while the rest of the service tolerates higher latency.
Metrics for dashboards and SLOs
A few keys from the builtin:service.keyRequest family, as listed in the built-in metrics reference:
| Key | Measure | Unit |
|---|---|---|
builtin:service.keyRequest.response.time |
Key request response time | Microsecond |
builtin:service.keyRequest.count.total |
Request count | Count |
builtin:service.keyRequest.errors.server.rate |
Server-side failure rate | Percent (%) |
builtin:service.keyRequest.errors.server.successCount |
Calls without server-side errors | Count |
In Data Explorer, builtin:service.keyRequest.response.time:percentile(90) gives a p90 per request, more telling than an average. For the availability SLI of a payment journey, the ratio between errors.server.successCount and count.server is the natural candidate; setting up the SLO is covered in create an SLO in Managed.
Dynatrace SaaS: what about a recent environment?
The official page is explicit: setting up key requests is not available for environments created in version 1.330 or later. It recommends enabling the Enhanced endpoints for SDv1 feature, which shows all endpoints in the Services app, not just key requests. In an older SaaS environment, the procedure above still applies through Services Classic. In Managed, it applies as is.
Best practices
- Mark requests per business journey (login, search, payment), not by reflex: 100 per service is a ceiling, not a target.
- Favour low-volume, high-stakes requests: those are the ones default alerting ignores.
- Manage the list through the API and version it; a
POSToverwrites, aPUTmodifies. - After each new request naming rule, check the service’s Key requests tab.
- Tie each key request to an SLO or an explicit threshold, otherwise it only decorates the service page.
How to check it works
- The request appears under Key requests/endpoints on the service page.
- Via the API,
GET /api/v2/settings/objects?schemaIds=builtin:settings.subscriptions.service&scopes=SERVICE-…returns yourkeyRequestNamesarray. - In Data Explorer,
builtin:service.keyRequest.count.totalshows data points from the time of marking.
If no data points arrive, compare the exact request name (case, prefix) with the one in the list: it is almost always a rename. To cut the noise that overly tight thresholds can cause, see also reducing Davis alert noise, and for generic service metrics, the built-in service metrics. Official reference: Monitor key requests.
Frequently asked questions
Does a key request recover history from before it was marked?
No: the documentation states that dashboard tiles only include data collected after marking. Mark your critical requests before you need them, not during the incident.
How does it differ from a calculated service metric?
A key request follows a named request, with built-in alerting and its own thresholds. A calculated metric filters and splits freely (by HTTP code, by request attribute), counts against other limits and is used like a built-in metric for alerting.
Why did my key request disappear after a release?
Detection is name-based. If the path or a naming rule changed, add the new name in the Key requests tab of the service settings or in keyRequestNames.
Conclusion
Key requests are a small setting with a high return: a few business requests marked, suitable thresholds and a derived SLI are enough to stop missing the payment outage buried under static-page traffic. Build the list with product teams, manage it through the API, and check it whenever naming changes.
span.observer is an independent community blog, not affiliated with Dynatrace LLC. Dynatrace is a trademark of its owner. Screen names, limits and availability may vary by version and platform (SaaS or Managed): check them in the official documentation.