APM Server tail-based sampling decides whether to keep a trace after seeing all of it, so you can keep every error and reduce the rest. According to the Elastic documentation, the decision is made when the trace completes, not at its start as with head-based sampling.
This guide focuses on the settings that hurt when ignored: interval, ttl, storage_limit and what happens when the disk saturates. It complements our article on OpenTelemetry tail sampling before Dynatrace, which covers the Collector approach. Here everything happens in APM Server, on the Elastic side.
All values below come from the Elastic documentation pages on tail-based sampling and its configuration (the “current” version, read on 30 October 2026) unless stated otherwise.
In brief
- APM Server tail-based sampling only works with an Elasticsearch output and needs enhanced privileges.
- Events wait for their decision on local disk, not in memory: storage and TTL are the two critical settings.
- By default
ttlis30m,intervalis1mandstorage_limitis0GB(up to 80% of the disk). - On saturation, events are by default indexed without sampling, which can overload Elasticsearch.
APM Server tail-based sampling: principle and prerequisites
With head-based sampling each transaction is drawn at random as it starts, before anyone knows whether it will fail. With tail-based sampling, APM Server holds a trace’s events until the root transaction ends, then applies policies. The documentation states that sampling is weighted random: traces with a longer root transaction duration are more likely to be kept. Metrics are computed from all events, sampled or not, and errors are kept whatever the decision.
Prerequisites quoted by the documentation: an Elasticsearch output (other outputs are not supported), enhanced privileges granted through a dedicated role, and availability on the Elastic Stack (not Elastic Cloud Serverless). Elastic APM agents and OpenTelemetry SDKs are covered; for OpenTelemetry the documentation recommends this mechanism over the tailsamplingprocessor because of the latter’s limitations.
Writing the sampling policies
A policy must have a sample_rate between 0 and 1. Optional conditions are trace.name (root transaction name), trace.outcome (success, failure or unknown), service.name and service.environment. Policies are evaluated in order, all conditions of a policy must match, and the list must end with a policy that sets only sample_rate. Without it, a transaction matching nothing is rejected with a “no matching policy” error.
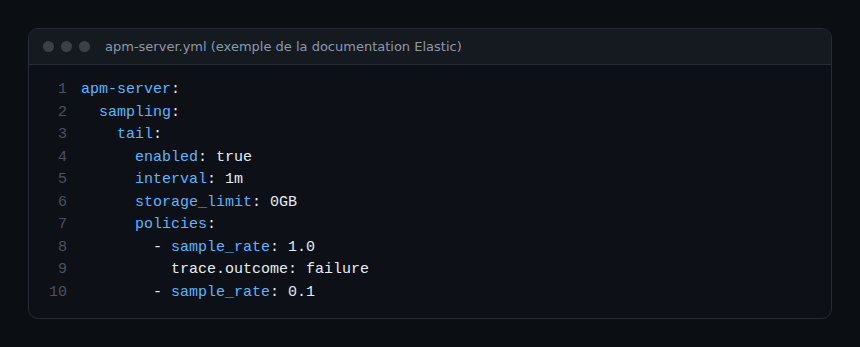
This documentation example keeps every failed trace and 10% of the others. Rules apply per trace, based on the service that started it, not on an individual service or span.
Tuning interval, TTL and storage_limit
Step 1: interval
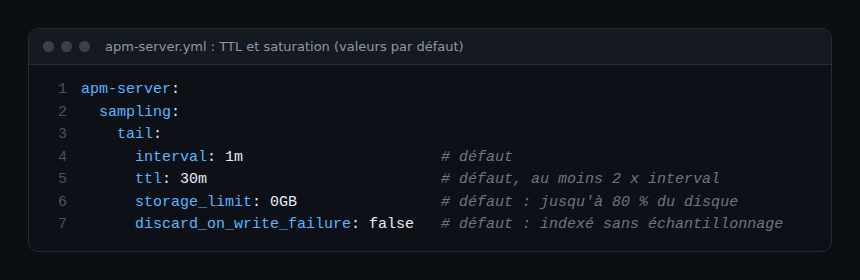
apm-server.sampling.tail.interval (default 1m) is the synchronisation interval between several APM Servers. The documentation suggests tens of seconds to a few minutes. Send all the services of a trace to the same APM Server cluster: if the root transaction never arrives, events are silently dropped.
Step 2: TTL
apm-server.sampling.tail.ttl (default 30m) sets how long events wait for a decision in local storage. It must be at least twice the interval. If the TTL expires before the decision, the event is dropped without being indexed. A longer TTL needs more disk. In Fleet, the TTL field appears from version 9.1.
Step 3: storage_limit
apm-server.sampling.tail.storage_limit (default 0GB): at zero, APM Server may use up to 80% of the disk holding the sampling database. A value in GB caps usage. Since version 9.0.0 the storage limit is unlimited by default but writing stops at 80% disk usage, and actual use may slightly exceed the limit.
What happens when storage saturates
When the disk is full, APM Server logs “configured limit reached”. What follows depends on discard_on_write_failure:
false(default): events skip sampling and are indexed straight away intotraces-apm-*. The effective rate becomes 100%, which can overload Elasticsearch.true: events are dropped. Indexing load stays bounded, but traces are lost and may look broken.
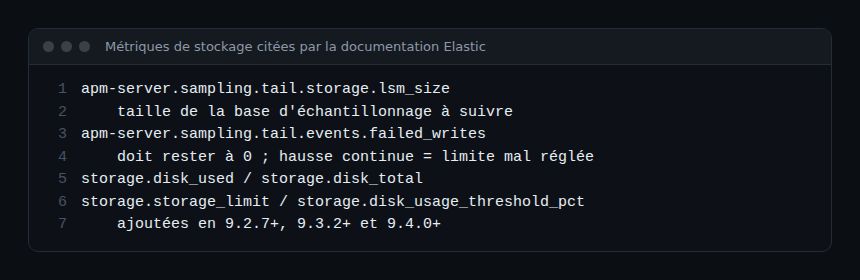
It is a platform-team trade-off: protect Elasticsearch or protect trace completeness. Versions 9.2.7+, 9.3.2+ and 9.4.0+ add a disk usage threshold: beyond it, new writes are rejected and this behaviour applies. According to the documentation the disk should be fast (high-IOPS SSD), since writes grow with the ingest rate.
Monitoring and sizing
Enable APM Server monitoring and watch lsm_size for occupancy. The failed_writes counter should stay at 0; a steady rise points to a misconfigured limit. Also watch for “too many open files”: check LimitNOFILE under systemd or ulimit -n. To see why rare traces are worth keeping despite the volume, read observability versus monitoring.
What this changes for an SRE team
Tail-based sampling moves the cost from network to disk: sizing storage becomes an operations task. Tools differ: in the OpenTelemetry Collector, the tailsamplingprocessor keeps spans in memory (decision_wait of 30s and num_traces of 50,000 by default according to its README) and requires every span of a trace to reach the same instance, see our guide to the Collector on Kubernetes. For a vendor overview read the Dynatrace and Datadog comparison. We claim no integration between APM Server and Dynatrace.
Best practices
- Always end the list with a
sample_rate-only policy. - Keep the TTL at least twice the interval, and size the disk before lengthening it.
- Decide
discard_on_write_failurein advance, then alert onfailed_writes. - Test on a non-critical environment before production.
Frequently asked questions
What is the default TTL for tail-based sampling?
According to the Elastic documentation, apm-server.sampling.tail.ttl is 30m, with a minimum of twice the interval.
What happens when storage is full?
By default events are indexed without sampling, which can overload Elasticsearch. With discard_on_write_failure: true they are dropped.
Does tail-based sampling work with an output other than Elasticsearch?
No, the documentation says it is supported only with the Elasticsearch output.
Sources
- Transaction sampling, Elastic documentation
- Tail-based sampling configuration, Elastic documentation
- Tail sampling processor, OpenTelemetry
span.observer is an independent blog, not affiliated with Dynatrace LLC or Elastic N.V. Product names belong to their respective owners; values come from the Elastic documentation, to be checked for your version.