Grafana Tempo stores your distributed traces, and kube-prometheus-stack already provides Prometheus and Grafana on the cluster. The two fit together: Tempo keeps the traces, Prometheus keeps the metrics derived from them, and Grafana links both in one interface. This guide installs Grafana Tempo next to kube-prometheus-stack, enables the metrics-generator and configures the Tempo data source in Grafana.
For an SRE team, the benefit is concrete. When an SLO degrades, you start from a RED metric in Prometheus, then jump to the trace that explains it. The path is shorter, so MTTR is too. This guide complements our Dynatrace and Grafana comparison with a hands-on look at the tracing side of the Grafana stack.
This content covers the open source Grafana and Prometheus stack. It depends on neither Dynatrace SaaS nor Dynatrace Managed.
In brief
- Grafana Tempo receives traces over OTLP (ports 4317 for gRPC and 4318 for HTTP in the chart) and stores them.
- Its metrics-generator derives metrics from spans and sends them to Prometheus through
remote_write. - On the kube-prometheus-stack side, two settings are enough:
enableRemoteWriteReceiverand ServiceMonitor discovery. - In Grafana, the Tempo data source points to Prometheus with
serviceMapandtracesToMetrics.
Prerequisites and versions
The values below were read in the chart files at the time of writing (31 October 2026). They change quickly, so read the values.yaml of the version you install.
- A Kubernetes cluster and Helm 3. The kube-prometheus-stack chart states version 92.16.1 (appVersion v0.94.2) and
kubeVersion >=1.25.0-0. - The
tempochart (monolithic, “single binary” mode), published in thegrafana-community/helm-chartsrepository, version 3.2.1 for Tempo 3.1.1. It requires Kubernetes ^1.25.0-0. - One
monitoringnamespace for everything. Adapt the addresses if you use another one.
According to the Tempo documentation, two charts exist: tempo-distributed (microservices) and tempo (monolithic). This tutorial uses the second one, which is simpler for a first deployment. Note also that the old tempo-distributed chart in the grafana/helm-charts repository is marked deprecated: true: current charts come from grafana-community.
Architecture: the path of a trace to Grafana
The flow has five steps. The application (or an OpenTelemetry Collector) sends its spans to Tempo over OTLP. Tempo stores them. Its metrics-generator computes service graph and span metrics. It pushes them to Prometheus. Grafana queries Tempo for traces and Prometheus for metrics.
This setup adds to an existing Collector. Our guide to the OpenTelemetry Collector on Kubernetes shows how to deploy that piece; you only need to add Tempo as an OTLP destination.
Step 1: prepare kube-prometheus-stack to receive remote write
By default, Prometheus does not accept remote writes. The chart’s values.yaml documents the setting: prometheus.prometheusSpec.enableRemoteWriteReceiver enables the server’s --web.enable-remote-write-receiver flag. Another important point: while serviceMonitorSelectorNilUsesHelmValues stays true, Prometheus only discovers ServiceMonitors that carry the release label. The chart README says to set it to false to discover them all.
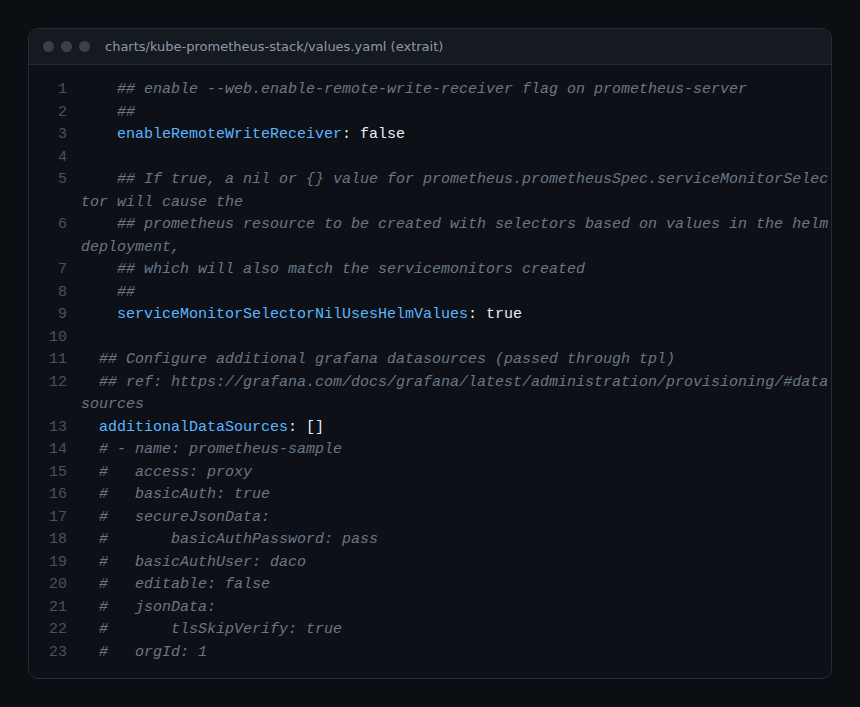
Here is the complete values file. The Tempo data source is declared in grafana.additionalDataSources, as the chart intends.
# kps-values.yaml
prometheus:
  prometheusSpec:
    enableRemoteWriteReceiver: true
    serviceMonitorSelectorNilUsesHelmValues: false

grafana:
  additionalDataSources:
    - name: Tempo
      uid: tempo
      type: tempo
      access: proxy
      url: http://tempo.monitoring:3200
      jsonData:
        serviceMap:
          datasourceUid: prometheus
        nodeGraph:
          enabled: true
        tracesToMetrics:
          datasourceUid: prometheus
          tags:
            - key: service.name
              value: service
          queries:
            - name: p95 latency
              query: histogram_quantile(0.95, sum(rate(traces_spanmetrics_latency_bucket{$$__tags}[5m])) by (le))
The UID prometheus is the one the chart gives to its default Prometheus data source. Port 3200 is Tempo’s default HTTP port, according to the Grafana documentation. The serviceMap, nodeGraph and tracesToMetrics keys follow the provisioning example in the documentation.
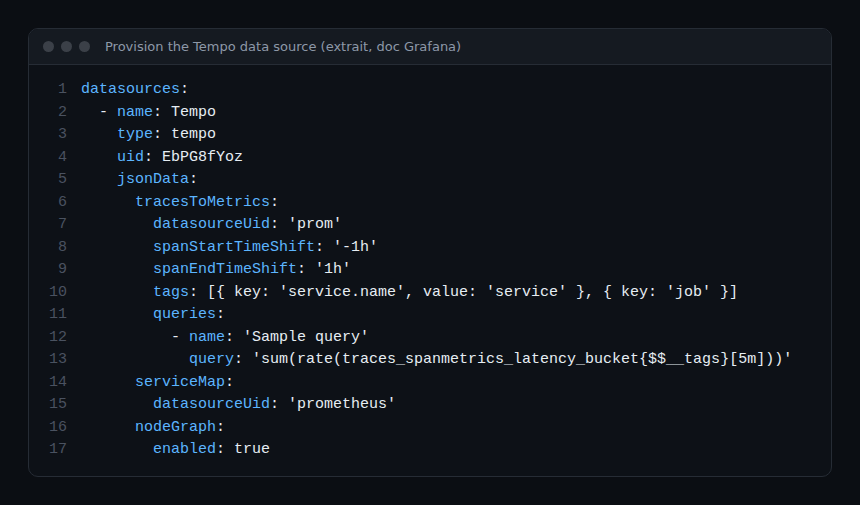
Install the stack:
helm install kube-prometheus-stack \
  oci://ghcr.io/prometheus-community/charts/kube-prometheus-stack \
  -n monitoring --create-namespace -f kps-values.yaml
Step 2: install Grafana Tempo with the metrics-generator
In the tempo chart, the metrics-generator is disabled by default (enabled: false). The remoteWriteUrl value is the write target when storage.remote_write is empty. The Tempo documentation states that processors are disabled by default: enable them in the overrides.
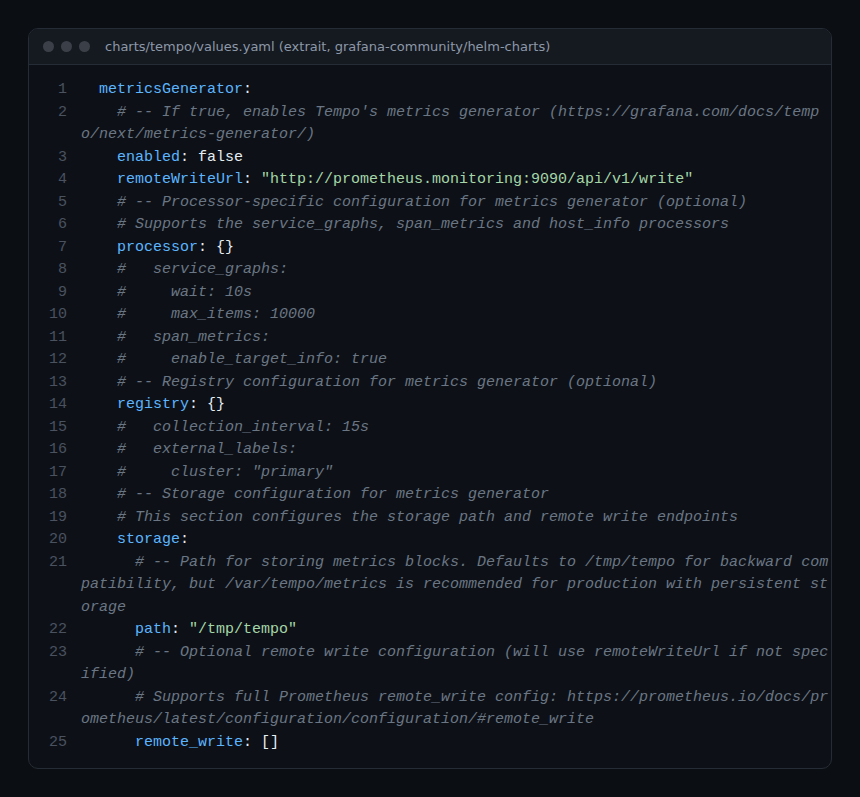
# tempo-values.yaml
tempo:
  metricsGenerator:
    enabled: true
    remoteWriteUrl: "http://kube-prometheus-stack-prometheus.monitoring:9090/api/v1/write"
  overrides:
    defaults:
      metrics_generator:
        processors:
          - service-graphs
          - span-metrics

serviceMonitor:
  enabled: true
Three notes on this file.
service-graphsandspan-metricsare processor names from the Tempo documentation. The first produces service graph metrics, the second RED metrics.serviceMonitor.enabledexists in the chart. It lets Prometheus scrape Tempo’s own metrics, provided step 1 lifted the label filter.- The Prometheus Service name (
kube-prometheus-stack-prometheus) follows the<release>-prometheusconvention that the chart uses in its example. Confirm it withkubectl -n monitoring get svc.
helm install tempo \
  oci://ghcr.io/grafana-community/helm-charts/tempo \
  -n monitoring -f tempo-values.yaml
The release is named tempo: the chart template then names the Service tempo, which matches the data source URL from step 1.
Step 3: send traces to Tempo
The chart opens the OTLP receivers on 0.0.0.0:4317 (gRPC) and 0.0.0.0:4318 (HTTP). A Collector therefore only needs an OTLP exporter pointing at tempo.monitoring:4317. For a first test, the Tempo documentation suggests OpenTelemetry’s telemetrygen or the “Intro to MLTP” sample application.
exporters:
  otlp/tempo:
    endpoint: tempo.monitoring:4317
    tls:
      insecure: true
Here, insecure: true suits an in-cluster test. In production, enable TLS. To avoid storing every trace, see also our article on tail sampling with OpenTelemetry.
How to check that it works
- Check the pods:
kubectl -n monitoring get podsshould show Tempo, Prometheus and Grafana asRunning. - In Grafana, open Connections, then Data sources, then Tempo, and click “Save & test”. The documentation says a success displays “Data source is working”.
- In Explore, pick Tempo and search for a trace sent in step 3.
- In Explore with the Prometheus data source, query
traces_spanmetrics_calls_totalandtraces_service_graph_request_total. If these series exist, remote write works.
The metric names come from the Tempo documentation: traces_spanmetrics_latency (histogram), traces_spanmetrics_calls_total and traces_spanmetrics_size_total for span metrics, with the labels service, span_name, span_kind and status_code. For service graphs, the same documentation lists, among others, traces_service_graph_request_total and traces_service_graph_request_failed_total.
Best practices
- Watch cardinality. The documentation warns that more enabled dimensions mean more cardinality. The
status_messagelabel is disabled by default for that reason. - Persist the data. The chart sets
persistence.enabled: falseby default and the defaultretentionis 24 h. Adjust both to your needs. - Review retention before an upgrade. The chart README describes a fix to retention enforcement in version 3.2.0.
- Keep a single metrics path. If your Collector already generates span metrics, avoid producing them twice. Our article OpenTelemetry and Prometheus helps split the roles.
- Test before production. The defaults (storage in
/tmp/tempo) are for trying things out, not for running them.
Frequently asked questions
Should I use the tempo or the tempo-distributed chart?
The tempo chart deploys Tempo as a single binary, which suits modest volumes. The tempo-distributed chart deploys the microservices to scale out. The Tempo documentation presents both without recommending only one.
Why does Prometheus reject the metrics-generator writes?
Most often, enableRemoteWriteReceiver was left at false, its default value in the chart. Also check the remoteWriteUrl and the Tempo logs.
Can Tempo run alongside Dynatrace?
OpenTelemetry separates trace production from trace destination. A Collector can therefore, in theory, route to several OTLP exporters. This dual setup is not detailed here and needs a test in your environment. For Dynatrace, see our Prometheus and Dynatrace guide.
Conclusion
With two values files, Grafana Tempo joins kube-prometheus-stack: traces go to Tempo, RED metrics and service graphs go to Prometheus, and Grafana links the two. Next, extend the stack with alerts on span metrics and SLOs.
Sources
- kube-prometheus-stack chart (README, values.yaml, Chart.yaml)
- tempo chart, grafana-community/helm-charts repository
- Tempo: deploy with Helm, Grafana documentation
- Metrics-generator, Tempo documentation
- Provision the Tempo data source, Grafana documentation
span.observer is an independent blog, not affiliated with Dynatrace LLC or Grafana Labs. Product names belong to their respective owners; versions and values are those read in the documentation and charts on the date given, and example addresses are fictitious.