
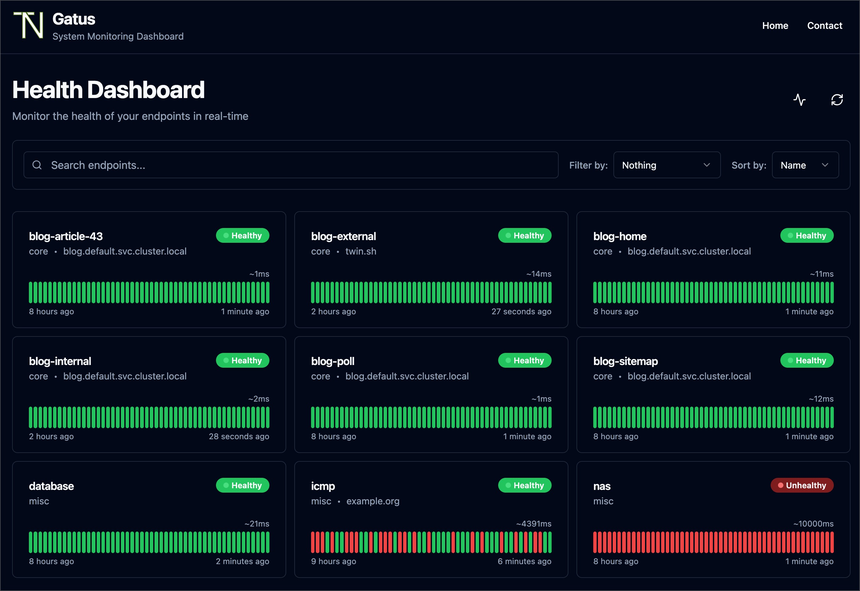
Tonight your load balancer goes down. No client is connected, so your error metrics stay flat and no alert fires. That scenario is where Gatus starts, and it is why a Gatus status page earns a place next to your dashboards: the project queries your services itself instead of waiting for real traffic to reveal the outage. The TwiN/gatus repository calls it a developer-oriented health dashboard.
So I start from three operating decisions rather than a feature tour: what counts as a healthy service, how many failures before someone gets woken up, and where the history lives. Everything is set in one YAML file.
A note on method: span.observer has not installed or run Gatus. The facts come from the README and the repository tree, read on 10 November 2026. The images are the repository’s own (Apache 2.0 licence) or a render of its sample configuration. The star count could not be re-read at the source that day, so I do not quote it.
Gatus status page: what the repository says
- Licence: the LICENSE file is the Apache License 2.0.
- Language: Go;
go.modasks for Go 1.26.3. - Version: the newest Git tag after cloning is
v5.38.0. The last commit on the main branch is dated 9 November 2026. - Probes: HTTP, ICMP, TCP and DNS queries according to the README; its FAQ also covers SSH, TLS, gRPC and WebSocket.
The README’s core argument is simple. A traffic metric goes quiet when traffic disappears, while an active probe keeps asking the question. The two approaches complement each other: the probe says “it answers”, telemetry says “how it behaves”.
First decision: what is a healthy service?
A 200 status proves almost nothing. Gatus accepts that: each endpoint carries a list of conditions, and a single false condition is enough to mark it unhealthy. Here is the README’s starter example:
endpoints:
  - name: website
    url: "https://twin.sh/health"
    interval: 5m
    conditions:
      - "[STATUS] == 200"
      - "[BODY].status == UP"
      - "[RESPONSE_TIME] < 300"
Three conditions, three different questions: does the server answer, does it say it is well, and is it fast enough? The README’s conditions table lists more, such as [CERTIFICATE_EXPIRATION] > 48h, [CONNECTED] == true, len([BODY].data) < 5 or [BODY].name == pat(john*). My advice: write the condition your user would feel, not the one that is easy to check. A certificate check at 48 hours avoids a silly Sunday outage.
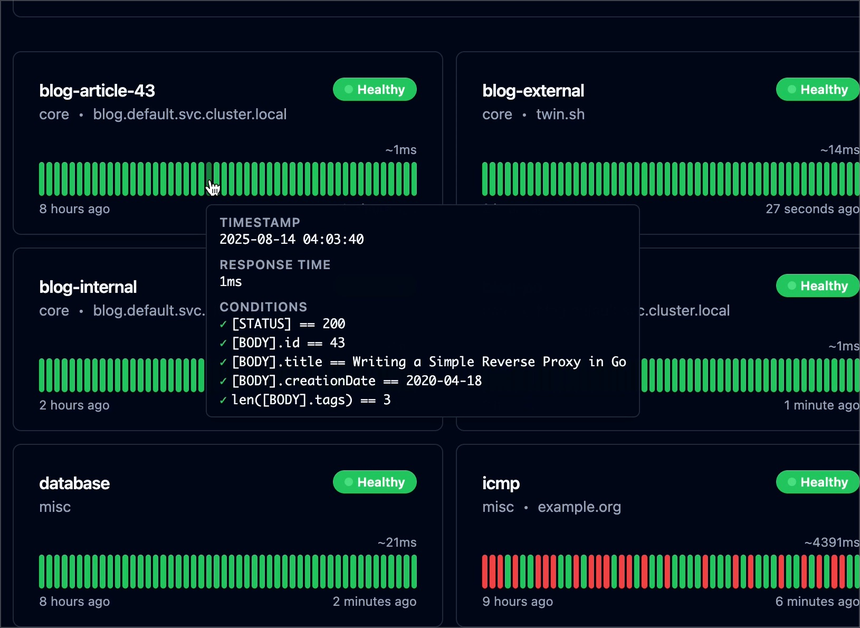
The endpoint card keeps the conditions evaluated on each run. Hover over a bar in the history and the dashboard shows the timestamp, the response time and each ticked condition.
Second decision: how many failures before the alert?
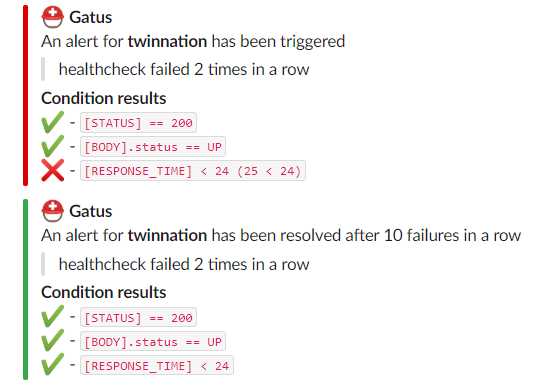
An alert on the first failure wakes the whole team for a dropped packet. The README therefore sets cautious defaults for each alert:
failure-threshold: 3 consecutive failures before triggering;success-threshold: 2 consecutive successes before closing the incident;send-on-resolved: false by default, so no closing message unless you ask;minimum-reminder-interval: disabled by default, and never lower than 5 minutes.
These settings encode a noise policy. The higher the threshold, the less you are disturbed, but the longer users live with the outage before you do. The README illustrates the trade-off with two alerts on the same endpoint: one at the third failure, one at the fifth, for a two-step escalation. The provider is declared once, globally, and each endpoint then refers to it:
alerting:
  slack:
    webhook-url: "https://hooks.slack.com/services/**********/**********/**********"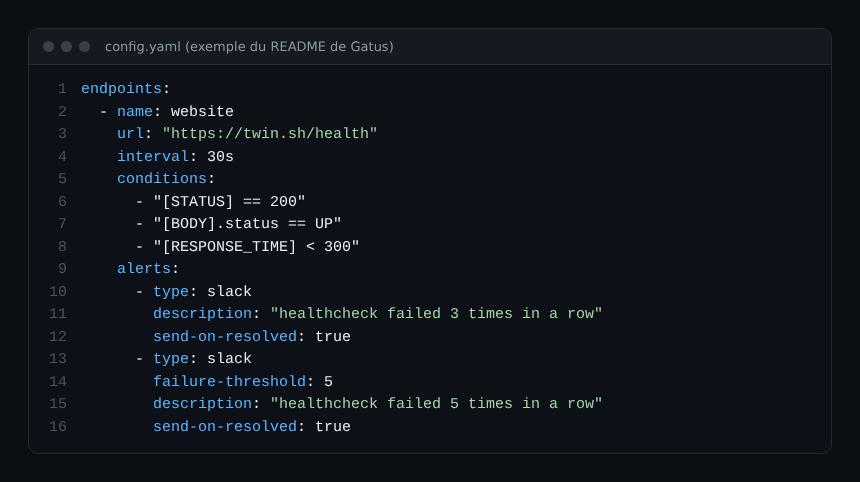
The repository supports many providers (Slack, Teams, PagerDuty, Discord, Telegram, ntfy, Opsgenie, email and others, judging by the alerting/provider folder). Beware: some carry a “not tested yet” warning in the README, Squadcast for instance. Check yours before trusting it with your on-call rota. For a method to sort signals, see https://span.observer/en/alert-on-symptoms-not-causes/; for the same threshold thinking on the Dynatrace side, see https://span.observer/en/reduce-alert-noise-davis/.
Third decision: where does the history live?
By default storage is in memory: a restart wipes the history and the uptime shown. The README offers sqlite (with a file path) or postgres (with a connection URL).
storage:
  type: sqlite
  path: data.db
Two more levers touch operations. Maintenance windows (maintenance.start, duration, timezone, every) avoid alerts during a planned deployment. External endpoints reverse the direction: an agent in a private network pushes its status to Gatus with a token, and heartbeat.interval creates a failure if no message arrives in time. That is the project’s answer when Gatus cannot reach the service itself.
Getting started and checking it works
The README gives a Docker command; the file-based version mounts your configuration at /config/config.yaml:
docker run -p 8080:8080 --name gatus ghcr.io/twin/gatus:stable
docker run -p 8080:8080 --mount type=bind,source="$(pwd)"/config.yaml,target=/config/config.yaml --name gatus ghcr.io/twin/gatus:stable- Write a
config.yamlwith a single endpoint and its conditions. - Run the second command and open
http://localhost:8080: the card should appear. - Break a condition on purpose (for example
[STATUS] == 201): the card should turn “Unhealthy”. - Wait for three failures: the alert should fire. Restore the condition: it should resolve after two successes if
send-on-resolvedis on.
Gatus reloads the file on the fly. If the new version is invalid it exits, unless skip-invalid-config-update is true. The README advises against that setting, and warns that detection may fail if you bind the file rather than the folder. Watch the log after every change.
Limits to know
- “Suites” are marked ALPHA, and remote instances are called experimental, with a risk of breaking changes.
- Execution is capped by
concurrency(3 by default): many slow endpoints, with a default 10 s timeout, can delay the others. The interval does not include the request’s own duration. - Gatus tells you whether a service answers. It does not tell you why: it replaces neither traces nor logs.
- I have not measured performance, so no load figure is given here.
Tying Gatus into your observability
With metrics: true, Gatus exposes Prometheus-format metrics on /metrics, on the application’s port. The README lists gatus_results_total, gatus_results_duration_seconds, gatus_results_certificate_expiration_seconds and gatus_results_endpoint_success (0 for failure, 1 for success), among others. You can alert on certificate lifetime with your usual engine, see https://span.observer/en/prometheus-alerting-rules-promtool-ci/. Collecting them with another tool (OpenTelemetry Collector, Dynatrace) is not verified here. For another project from the same series, see https://span.observer/en/argo-cd-gitops-kubernetes-guide/.
Best practices
- Probe the user path (login, key API call), not just a home page.
- Keep
failure-thresholdat 3 at first, then tune it using your false-alert history. - Move to
sqliteorpostgresas soon as the history matters. - Never commit a webhook token to a public repository: the README supports environment variables in the file.
- Run Gatus outside the infrastructure it watches, or it goes down with it.
Frequently asked questions
Does Gatus replace Prometheus or Dynatrace?
No. Gatus answers “does the service respond as promised?”. Metrics, traces and logs explain the causes. The two approaches complement each other.
What licence does Gatus use?
The repository contains the Apache License 2.0 text. Re-read the LICENSE file before any redistribution.
How do I avoid alerts during maintenance?
Define maintenance globally, or maintenance-windows on one endpoint, with a start time, a duration and a time zone.
Conclusion
Gatus comes down to one YAML file and one useful question: would I know it breaks before my customers do? The three decisions (conditions, thresholds, storage) do most of the work. Keep the active probe alongside your telemetry, and test it by breaking it on purpose.
This blog is independent and not affiliated with Dynatrace LLC. Gatus is a third-party project, not published by Dynatrace.