On Friday the question comes up in the team meeting: can we host a large open model on the office workstation, without an eight-GPU server? For a local MoE model, the answer hinges less on raw compute than on a trade between RAM, disk and patience. Colibri, a C inference project on GitHub, is built to make that trade for you.
I start from the operating decision rather than the install: what should you know before downloading 400 GB? A note on method: I have not run Colibri. Everything below comes from the JustVugg/colibri repository, read on 10 November 2026 (README, CHANGELOG, API documentation). The speeds quoted are the project’s own, on its own machines.
The repository is Apache 2.0 licensed. Version 2.1.0 is dated 31 October 2026 and activity is daily. GitHub showed roughly 49,500 stars and 5,800 forks (rounded by the page, not exact). The project is young and moves fast, so treat its numbers as measurements to reproduce.
Local MoE model: why RAM is no longer the only gate
A mixture-of-experts (MoE) model is huge on disk but frugal per token. According to the README, GLM-5.2 has 744 billion parameters, activates about 40 billion per token (5.4%), and only about 11 GB change from one token to the next: the routed experts.
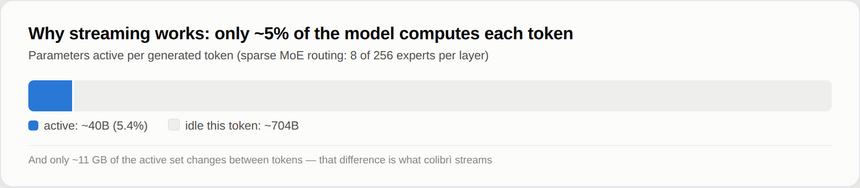
The practical consequence is simple. The model does not need to fit in fast memory; it needs to be placed. Colibri keeps the dense part (attention, shared experts, embeddings) in RAM and reads experts from disk on demand, through a cache that learns which ones your usage calls for. A GPU, if present, holds the hottest experts.
The project stresses one point: where a weight sits changes speed only, not the output. Less fast memory may cost time, never the model’s precision, the README says. That is the project’s promise, and I cannot confirm it without measuring.
How many tokens per second: read the table before dreaming
For each model the README gives a RAM floor below which nothing starts, and a second figure from which the measured speed is reached. A few rows, as published:
- Qwen3.6-35B-A3B (23 GB download): 6.0 tokens/s on CPU, 30.0 with CUDA on an RTX 3070;
- DeepSeek V4 Flash (167 GB): 0.93 tokens/s with 32 GB of RAM, CPU only;
- GLM-5.2 (429 GB, 16 GB RAM minimum): 0.05 to 0.1 tokens/s cold on a 25 GB laptop, 1.83 on a 128 GB machine, 9.0 to 9.2 on six RTX 5090 cards;
- Kimi K3 (1.56 TB): about 9.4 seconds per token.
Read this the way an SRE reads an SLO. A laptop producing one token every ten to twenty seconds answers “correctly” yet serves nobody. For overnight batches, evaluation or a solo assistant, under one token per second can be enough. For a team chatting live, aim at the small models or at a GPU.
The disk is the deciding factor for big models. The project says a fast NVMe drive helps most, and that two NVMe drives on independent controllers measured +37.5% decode speed. A single slow disk is not a detail: it is your ceiling.
Installing Colibri: what the README says
Stated minimum hardware: 8 GB of RAM (16 GB or more recommended), 22 GB free for the smallest model, and an internet connection. The GPU is optional; Vulkan, CUDA and Metal are supported depending on the engine. The one-step route on Linux:
sudo apt install git python3 build-essential
git clone https://github.com/JustVugg/colibri
cd colibri
./start-here.sh
On Windows you unzip the archive and run START-HERE.bat; on macOS you install the Xcode command-line tools, libomp, git and python with Homebrew, then run the same script. The setup inspects the machine, recommends the most capable model that fits in RAM, builds the engine, downloads with resume, then opens the dashboard. Useful options: --list compares every model against your machine, --model ID forces one, --dir changes the target disk.
Before committing 400 GB, three launcher commands exist to help you decide, again per the README: coli plan shows where the model will live (VRAM, RAM, disk), coli doctor checks without changing anything, and coli tune measures and saves the fastest safe settings for the machine.
Watching the experts work
The dashboard (coli web) and the coli ui interface show an expert map: one cell per expert in each block, white when chosen in the current step, amber when used in the answer. The capture below shows OLMoE, the 7-billion-parameter model the project recommends for learning the tools.
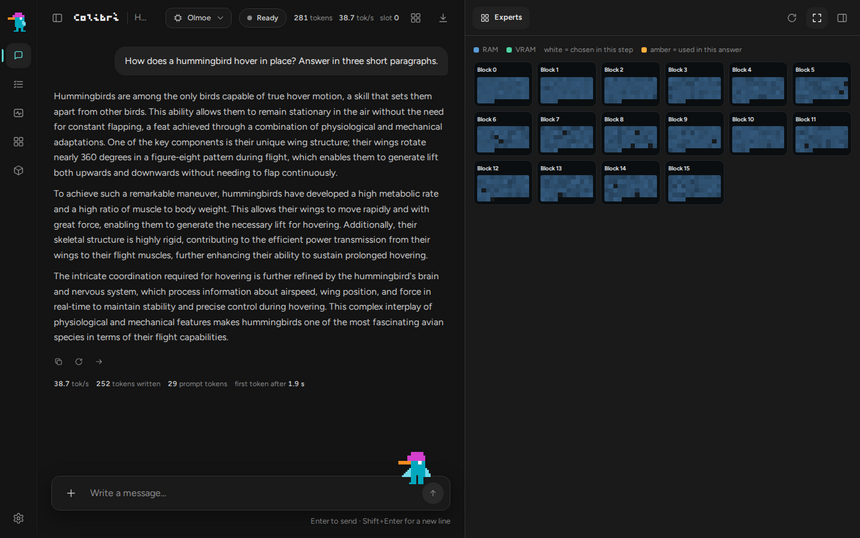
A second screen, the monitor, shows the model state (idle, reading, writing), speed, prompt reading time, and the engine’s RAM and CPU.
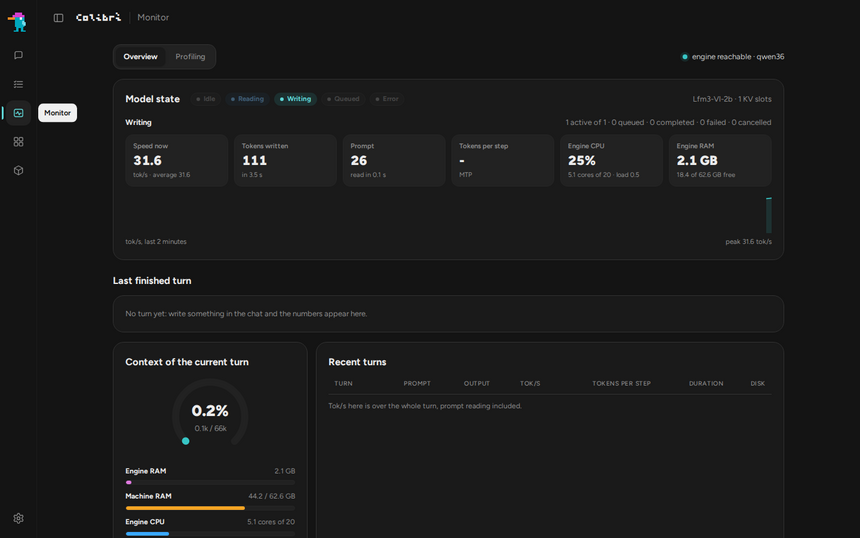
Both captures come from the project’s repository (Apache 2.0). They show small models running comfortably, not a big model struggling. Do not take them as proof of speed on a 744-billion-parameter model.
Exposing and monitoring the server
coli serve starts an OpenAI-compatible server (/v1/chat/completions) and an Anthropic-compatible one (/v1/messages). By default it listens on localhost. According to the documentation, you must set COLI_API_KEY before exposing it to the network. Do that first: an inference server without a key on a corporate network is a free entry point.
For monitoring, the API documentation describes two useful endpoints. GET /health exposes active, queued, completed and rejected counters, answers 503 with {"status": "restarting"} while the engine restarts, and counts restarts in engine_restarts. GET /metrics serves Prometheus text whose names all start with colibri_scheduler_, with gauges (active, queued), counters (completed_total, failed_total, rejected_total, timed_out_total) and histograms (queue_wait_seconds, first_output_seconds, engine_call_seconds). The metrics carry no prompt and no model path.
An OpenTelemetry Collector can scrape them with the Prometheus receiver. Minimal example, to adapt (target and exporter are sample values):
receivers:
  prometheus:
    config:
      scrape_configs:
        - job_name: colibri
          scrape_interval: 30s
          authorization:
            credentials: ${env:COLI_API_KEY}
          static_configs:
            - targets: ["127.0.0.1:8000"]
exporters:
  otlphttp:
    endpoint: ${env:OTLP_ENDPOINT}
service:
  pipelines:
    metrics:
      receivers: [prometheus]
      exporters: [otlphttp]
I have not tested this configuration against Colibri, nor checked ingestion on the Dynatrace side, Managed or SaaS: it is a standard Collector setup. The signals to follow: queue_wait_seconds for contention, first_output_seconds for what the user waits through, and failed_total with engine_restarts to spot an engine killed by the out-of-memory killer. For more on monitoring a local engine, see our article on Ollama and the one on vLLM in production.
Limits and open questions
- The repository is young and changes fast: 387 pull requests between versions 2.0.0 and 2.1.0, per the CHANGELOG. Pin a version.
- The project lists its own optimisation ideas as hypotheses to reproduce, with failures published, for example MTP speculation measured 32% slower around an 85% expert hit rate. That is a good sign of honesty, and also proof that settings must be measured machine by machine.
- Every speed comes from the project: none was reproduced here.
- Some models carry their own licence (Qwen-Image non-commercial, Muse Spark Open under a Meta agreement): the engine’s Apache 2.0 does not cover the weights.
- Compare with more common engines before choosing: see the Ollama, vLLM and llama.cpp comparison and, for a big model on GPUs, self-hosting Mistral Large 4.
Best practices
- Start with a small model (OLMoE or Qwen3.6) to check the whole chain before the big download.
- Put models on the fastest NVMe drive, never on a network mount or
/mnt/cunder WSL, which the README advises against. - Set
COLI_API_KEYand keep listening on localhost until an authenticated reverse proxy is in place. - Scrape
/metricsfrom day one, with an alert onfailed_totaland on the duration offirst_output_seconds. - Record your own measurements (hardware, command, cache state): the project asks for them, and they are what will give you a credible SLO.
Frequently asked questions
Do I need a GPU for a local MoE model with Colibri?
No, according to the README: every engine runs on the CPU. A GPU is a faster place to keep weights. For big models the disk sets the speed; for small ones, the RAM.
What speed can I expect on an ordinary machine?
It varies by more than 100 times with the model: a few tokens per second for a 35-billion-parameter model, under one token per second for the very large ones. Measure with coli tune on your own hardware rather than trusting a table.
Is Colibri suitable for a team?
The server manages a queue, cache slots and 429 refusals, but I have not verified its behaviour under load. Test with your own usage and watch the queue before opening the service.
Conclusion
A local MoE model is realistic because only a small fraction of the parameters works on each token. Colibri takes that idea to its end: RAM keeps the core of the model, the disk keeps the rest. Before downloading, read the table for your machine, run coli plan, and wire up /metrics so that the advertised speed becomes a measured one.
This blog is independent and not affiliated with Dynatrace LLC. Colibri is a third-party project; the information comes from its public repository and may change, so check it before any production use.