Your AI agent gave three customers a wrong answer last night, and nobody knows which tool call went sideways. You can read traces by hand, or plug in something that sorts them. traceroot (traceroot-ai/traceroot) takes the second route. This is my reading of this traceroot AI agent observability platform: what the repository holds, how to start it, and above all what its licence really allows.
Facts as of 10 November 2026, read from the cloned repository: last commit dated 10 November 2026, Apache 2.0 for most of the code, an “Enterprise” licence for directories named ee. I could not read the star count, so I do not quote one. I did not deploy the platform: everything below comes from the README, the docs and the code, and the screenshots come from the repository.
The problem: an agent in production is judged over thousands of traces
An agent does not fail like a classic service. No HTTP 500: a plausible but wrong answer, a tool called twice, a bill that creeps up. Three needs follow: see each step, flag bad runs without rereading everything, and measure cost.
The README frames it as a loop from trace to verified fix, in four steps.
- Trace: every model and tool call, with inputs, outputs, latency and cost.
- Detect: “detectors” that flag production runs that miss the mark.
- Signals: repeated findings are clustered into signals; a background agent suggests leads from the traces and the connected GitHub code.
- Verify: evaluations on datasets to compare versions.
Traceroot AI agent observability: what the interface shows
The repository docs illustrate a timeline view. The session tree is on the left, bars on the right: agent turns contain model calls (ChatCompletion) and tool calls (get_weather, calculate). Each model call shows its input and output tokens and its cost.
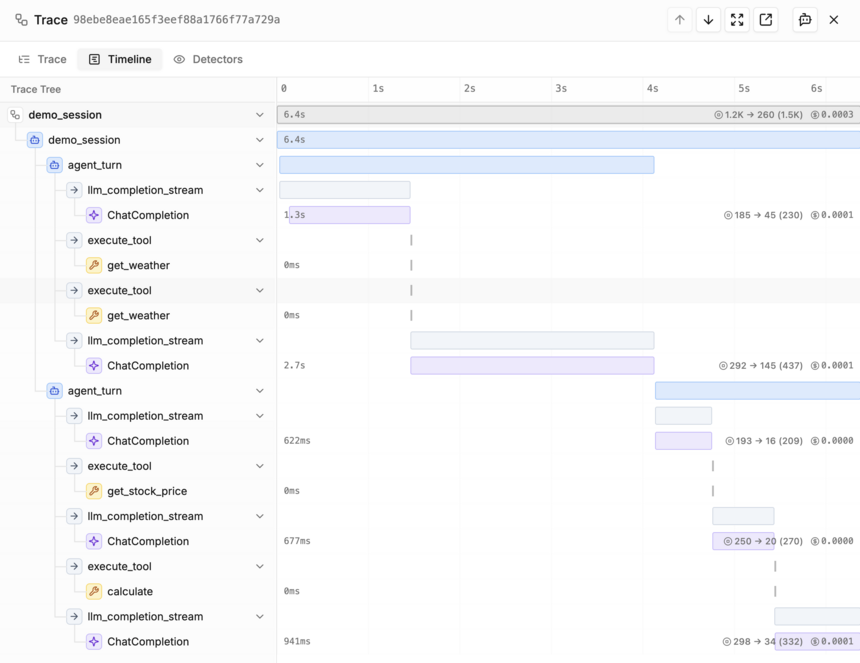
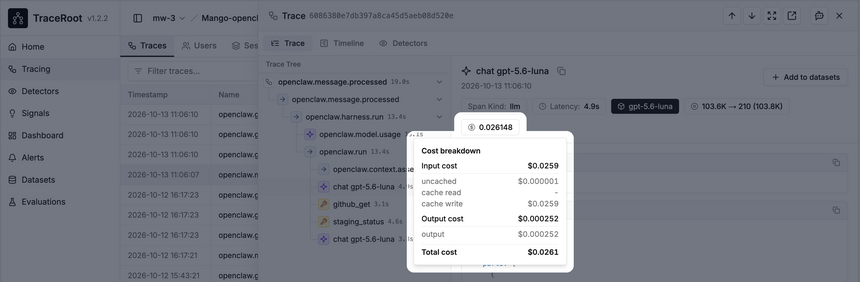
A second screenshot details the cost: a tooltip splits input cost (uncached, cache read, cache write) from output cost. That is the detail that explains why a long prompt is expensive. The values are from the project’s demo data, and the image shows version v1.2.2.
Two separate watching mechanisms. A detector has a judge model read one trace and answer yes or no; a yes becomes a finding. An alert watches a number over time (for example p95 latency of model calls over ten minutes) and posts to Slack when its state changes. The docs say alerts work on every plan, self-hosted included, and so do detectors, with 100 detector runs included on the free tier of the cloud service.
Starting locally: four commands
According to the README you need Git, Docker Compose and Make. The prod-lite target first generates any missing secrets in the .env file (read in the Makefile), then starts the stack.
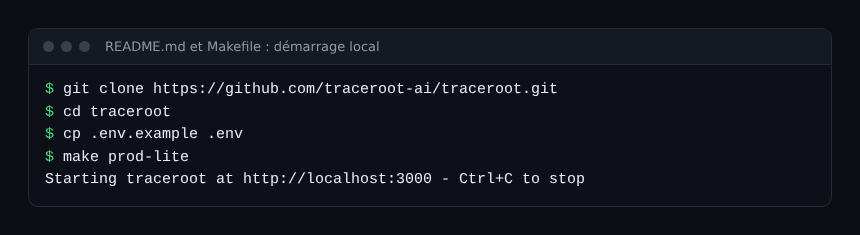
Then open localhost:3000. docker-compose.prod.yml declares PostgreSQL, ClickHouse, MinIO and Redis, plus application services (web, API, worker, detector, agent). Budget memory and disk accordingly: I did not measure the footprint.
To send a first trace, the README suggests npx -y traceroot-cli@latest setup (Node.js 20.12 or later), which writes an API key to your env file and has a coding agent add the SDK. Manually, use the Python or TypeScript SDK with TRACEROOT_API_KEY and TRACEROOT_HOST_URL; self-hosted, the URL points at your instance. The README lists integrations for LangChain, LlamaIndex, CrewAI, OpenAI Agents SDK, Vercel AI SDK, Mastra, and providers Anthropic, OpenAI, Gemini, Mistral and OpenRouter.
The licence question: read it before saying “open source”
The LICENSE file announces two regimes. Everything is Apache 2.0 except directories named ee, covered by an Enterprise licence. The text of ee/LICENSE says that code may be used in production only if you agree to the vendor’s terms of service or another agreement, and hold a licence key for the right number of seats.
In the code the key is TRACEROOT_EE_LICENSE_KEY, and the comment in ee/license.py names SSO, audit logs and RBAC as the gated features. A cautious conclusion: the core is free, some enterprise features are not. Before deploying, list the features you need and ask the vendor what falls under ee: I did not cross-check all of it.
Limits and open points
- Maturity.
pyproject.tomlsays version 0.1.0 while the interface shows v1.2.2: the gap is unexplained. The README carries a Y Combinator (S25) badge. - Deployment. The docs describe a Kubernetes path with Helm and Terraform but call it experimental, and point to a
deployfolder I did not see in my clone. I say so as is. - Data. Prompts and outputs pass through the platform. Read
SECURITY.mdand mask secrets before sending. - Detectors. A judge model burns tokens: it costs money, it can be wrong, and it reads your traces.
- Dynatrace. No official link between traceroot and Dynatrace.
Fitting it into your monitoring
- Start with one non-critical agent and a low detector sampling rate.
- Create two simple alerts first: p95 latency and cost over a rolling window. See the token cost of an AI agent.
- Keep a conversation identifier shared with your APM, to jump from the agent trace to the infrastructure trace.
- Bound what the agent may do: AI agent guardrails in production.
- Compare with other projects: Observal for coding agents, AgentLens for the audit trail, and OpenInference to Dynatrace if your traces must land in your observability platform.
Frequently asked questions
Is traceroot really open source?
Mostly: Apache 2.0 for code outside the ee directories. Those follow an Enterprise licence with a key. Check which features you are after.
Can I self-host without a cloud account?
The README describes a local Docker Compose start and a self-hosting mode for the CLI (--host and --auth-host options). I did not test it end to end.
Does it replace Dynatrace?
No. It focuses on agent behaviour (calls, cost, detectors). Infrastructure correlation, SLOs and root cause stay with your observability platform.
Conclusion
traceroot deserves a trial if your agents already run and you want to see and sort their failures. Read the licence before committing a team to it, and treat the Kubernetes deployment as experimental. For the span attributes to emit, see the OpenTelemetry GenAI conventions.
This blog is independent and not affiliated with Dynatrace LLC. traceroot belongs to its authors. The screenshots come from the project repository (Apache 2.0 licence); I did not test the software.