



A payment leaves the browser, crosses three microservices, then vanishes into a CICS transaction nobody can see. To keep that payment under control, you have to decide how to approach IBM z mainframe monitoring before installing anything: which partitions, which regions, which transactions, and at what cost. This article starts from those operating decisions.
The facts come from the official Dynatrace documentation for z/OS and from the vendor’s post on the IBM z17 mainframe, read on 12 November 2026. I have no mainframe at hand, so I installed nothing, and whatever is unverified is flagged as such.
For the distributed side of the calls, see Distributed traces and PurePath. The mainframe module extends those traces. It does not replace them.
The problem: the trace stops at the mainframe door
A distributed trace follows a request from service to service. On the mainframe, however, the request enters a CICS or IMS region, triggers Db2 or MQ calls, then comes back out. Without dedicated instrumentation, that segment is a black box. Response time climbs, and nobody knows whether the front end, an API or the transactional core is at fault.
The vendor post presents mainframe monitoring as end-to-end tracing from the web front end to the core of the IBM z17, with one unified hybrid view. It also mentions the machine’s Telum II processor and Spyre accelerator. It is an overview text: it gives no version, no prerequisite and no figure. For operations, the documentation is the reference.
How IBM z mainframe monitoring moves the data
The documentation describes a chain of four links. It explains why you install per partition (LPAR) and not per application.
- Code modules for CICS, IMS and z/OS Java write their measurements to a shared memory object (SMO) in the LPAR.
- The zDC subsystem (Dynatrace z/OS Data Collection) manages that object.
- zLocal, which runs in z/OS UNIX System Services as part of the zDC, reads the SMO and passes it to zRemote.
- zRemote sends the compressed, encrypted data to Dynatrace through its local ActiveGate.
This split has a practical consequence: processing happens outside the instrumented subsystems. According to the documentation, CICS is instrumented with hooks and IMS by reading its binary logs, with no bytecode instrumentation. It reports a GCP time overhead that is typically 1 to 2%, measured on the monitored address spaces. That is the vendor’s figure, so measure it on your own system.
To understand the ActiveGate’s role in this chain, read the comparison of environment and cluster ActiveGates.
Decision 1: check that your mainframe is covered
First, compare your versions with the lists on the “Mainframe technology support” page. At the time of reading, it lists:
- z/OS 2.3, 2.4, 2.5, 3.1 and 3.2;
- CICS Transaction Server 5.1 to 6.3;
- IMS 13, 14 and 15 (Fast Path and BMP transaction tracing exists only for IMS 15);
- Db2 11, 12 and 13;
- for Java: IBM JVM 8 and IBM Semeru 11, 17, 21 and 25.
The page does not mention z17 hardware as such. It does not mention SaaS or Managed either. I therefore cannot say what applies to which; ask your Dynatrace contact before you plan.
Decision 2: the cost is counted in MSUs
The CICS, IMS and z/OS Java modules are consumed in million service units (MSUs). The Platform Subscription model calls it “Mainframe Monitoring”; the classic licensing model says “Mainframe Monitoring on IBM z/OS”, based on host units. One operating detail matters: since OneAgent 1.315, tracing is suspended if the host.zos.msu_hours metric does not arrive for 12 consecutive hours. A long network cut towards zRemote therefore affects tracing, not just billing.
Install without surprises: the order that matters
Here are the documented steps, in the order I would put them on a change plan.
- Download the z/OS datasets and note the high-level qualifier (
<hlq>). - Create the zDC RACF user, with a USS segment (recommended home directory:
/u/dt). - Run the
COPYAGNTjob fromSZDTSAMP, then copy thedtzagentbinary. - APF-authorise the
<hlq>.SZDTAUTHlibrary. - Copy the
ZDCMEPCprocedure (default subsystem name:MEPC) and fill inDTAGTCMD()with the zRemote address. - Check the SMF exit: U86 from OneAgent 1.300, required for licensing metrics and for z/OS 2.3 or later.
- Run the
ZDCIVPprocedure to test the connection.
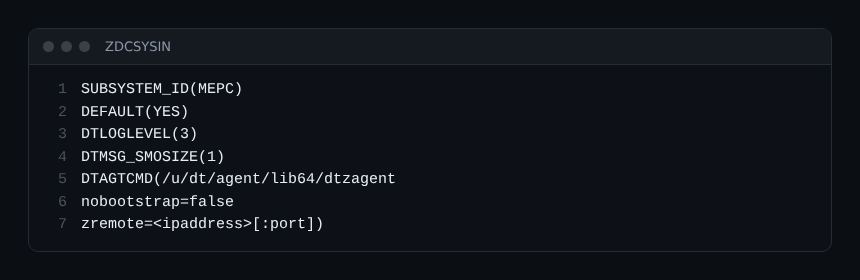
The zDC must run as an authorised started task, launched at IPL, with a higher priority than the monitored CICS and IMS regions. One instance per LPAR is expected. After any change to ZDCSYSIN, restart the zDC.
Hooking up CICS, region by region
On the CICS side, you declare the SZDTLOAD library in the DFHRPL concatenation, then define the resources with the CICRDO member and the DFHCSDUP utility. The ZDTPLT program goes into the PLTPI table and ZDTPLTSD into the PLTSD table. A CICS 6.2 region also needs the DFHBPZDT module available at startup.
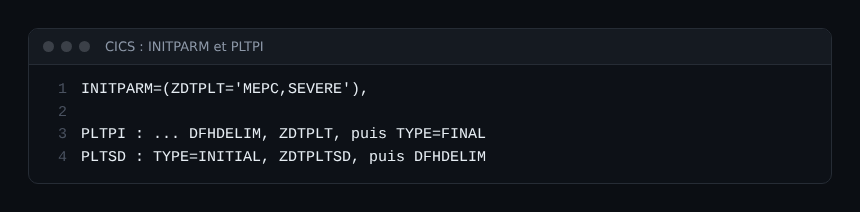
The module connects to the default zDC at startup. If the zDC is not running, the job log shows ZDTP004W. Start the zDC, then run the DTAX transaction with the ENABLE option.
Decision 3: which transactions to trace
This is the setting that changes the result the most. Dynatrace automatically traces transactions started by a monitored service, by CICS Transaction Gateway, by z/OS Connect EE or by IBM MQ. Those that start on a terminal or at an unmonitored service must be listed.
- The terminal start filter accepts the
*wildcard and requires the “z/OS CICS terminal transaction sensor” feature (or its IMS equivalent). - The CICS start filter accepts the wildcard only as a suffix, never alone. Do not use
C*: it captures CICS internal transactions. - A listed transaction that is then called through MQ, SOAP or HTTP creates a new, unlinked trace.
The settings live under Settings > Mainframe. The distributed PurePath node limit is 500 by default there; the value 0 removes it, at the price of extra processing overhead. Keep in mind too that the modules capture only static SQL, not dynamic SQL.
How to check that it works
Check three places: the zDC SYSPRINT, the CICS region log and the zRemote log.
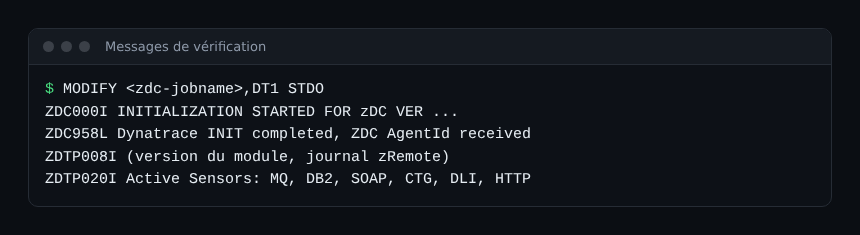
The ZDC958L message confirms that the zDC received its agent ID. In the zRemote log, ZDTP008I gives the module version and ZDTP020I the list of active sensors. Mind compatibility: the CICS module version must be lower than or equal to the zRemote version.
To query your data afterwards, the language basics are in the DQL filter, summarize and timeseries commands. I have not verified which mainframe fields are exposed there.
Best practices
- Start with one test LPAR and one CICS region, then widen.
- List your business entry transactions before opening the filters: avoid
*in production. - Watch the
host.zos.msu_hoursmetric: its absence suspends tracing. - Use host groups to organise several LPARs.
- Measure the CPU overhead on your own system before rolling out.
Frequently asked questions
Do I need an IBM z17 mainframe to use this monitoring?
I have not verified that. The support page lists z/OS, CICS and IMS versions, not machine models. Check with the vendor for your hardware.
Is dynamic SQL visible?
No. According to the documentation, the CICS and IMS modules capture only static SQL.
Does it work on SaaS and Managed?
The pages I read do not say. I cannot settle it, so assume nothing and confirm before sizing the ActiveGate.
Conclusion
Monitoring an IBM z mainframe comes down to three choices: coverage of your versions, the MSU cost and the list of traced transactions. The rest is one installation per LPAR, tested first on a small scope. Sources: Dynatrace documentation for z/OS, mainframe technology support.
span.observer is an independent community blog, not affiliated with Dynatrace LLC or IBM. Brands mentioned belong to their owners. Products change quickly: check versions and options in the official documentation.