
A service answers in 4 seconds instead of 300 ms, the error rate climbs and three teams pass the problem around. Metrics tell you something is wrong, not where. Dynatrace Managed distributed traces answer that question: they follow a request end to end, service by service, down to the method that burns the time.
This practical guide shows how to use the Distributed traces view (Distributed Traces Classic) day to day: filter thousands of requests down to three, read a waterfall, drill into code, jump to the logs, and know the retention limits specific to Managed. Two practical sections detail how to diagnose a slow request in five steps and the pitfalls to know: sampling, incomplete traces, missing request attributes. Each scenario (slowness, errors, third-party call, database, regression after a deployment) is tied to a lower MTTR.
Scope: this content applies to Dynatrace Managed. Dynatrace SaaS offers the same classic view, plus a Distributed Tracing app built on Grail and DQL, which does not exist in Managed.
PurePath, trace, span: the useful vocabulary
The Managed documentation defines a distributed trace as a sequence of spans, identified by a unique trace ID, that follows a request through services. A span is one operation; the span without a parent is the trace root span. PurePath refers to traces captured by OneAgent; traces instrumented with other libraries (OpenTelemetry, for instance) show up as Ingested traces.
Context travels between services in headers: x-dynatrace (proprietary format), traceparent and tracestate (W3C, shared by OneAgent and OpenTelemetry), and dtdTraceTagInfo for some messaging systems. If a proxy or gateway strips these headers, the trace splits in two: that is the first cause of an “incomplete trace”. For message queues, see context propagation with Kafka.
Prerequisites
- A Dynatrace Managed environment with OneAgent in full-stack mode on the processes to trace (code level requires OneAgent).
- Management zones in place: the trace list is limited to the selected zone (see management zones and tagging).
- For the request attributes API: a token with
ReadConfig(read) andCaptureRequestData(create). - For a mixed OneAgent and OpenTelemetry environment: W3C Trace Context turned on in Settings > Preferences > OneAgent features (Send W3C Trace Context HTTP headers and Send W3C Trace Context gRPC headers).
Using Dynatrace Managed distributed traces step by step
- Open the view. Distributed traces menu, or from a service: Services > More (…) > Distributed traces, which pre-filters on that service.
- Set the timeframe and management zone. The Overview chart shows request count and response time. Beyond 10 days, turn on Show data retention to see which data is still available.
- Choose the source. PurePaths for OneAgent, Ingested traces for OpenTelemetry or other libraries.
- Filter with Filter requests (details below), then sort the list by Start time, Name, Response time, Processing time, HTTP method or Response code.
- Expand a row for an overview (topology, attributes, HTTP, timings), then select the trace name.
- Read the trace: Execution breakdown for the time distribution, the waterfall for service order, then a segment to open the detail tabs.
Filters and useful combinations
The list shows at most the 3,000 most recent traces for the timeframe and management zone. On a busy service, a window that is too wide buries the interesting request: filter before you read.
| Filter | Use |
|---|---|
| Timeframe | Frame the incident or deployment as tightly as possible |
| Management zone | See only the application or team concerned |
| Ingestion method | PurePaths (OneAgent) or Ingested traces |
| Service name | Start from the service in pain |
| Response time (≥, ≤) | Isolate slow requests above a threshold |
| Request attributes | Target a customer, a country, a basket, a version |
| Search (trace ID) | Find the trace quoted in a log or a ticket |
Combinations that often help:
- Service + Response time ≥ SLO threshold: only the requests consuming the latency error budget. In the documentation example, this filter brings 249,000 requests down to 3.
- Service + sort by Response code: 5xx rise to the top, ready for the Errors tab.
- Request attribute + Response time: “is this premium customer slower than the others?”.
- Service flow filter: in View service flow, select a called service then Apply filter, add a second service, and open Distributed traces on the caller. You get only the requests that go through that call chain.
Analysing a trace: waterfall, timings, code level, logs
The waterfall shows which services the trace crosses and in what order. Bar position and colour show the sequence and response time of each request: two overlapping bars run in parallel. Select a segment to open the tabs:
- Summary: metadata, headers, parameters, proxy. Five asterisks (
*****) hide confidential data, which users with the right permissions can unmask; three or fewer are used for aggregation and cannot be unmasked. - Timings: View method hotspots breaks down CPU, wait, sync, lock and execution time.
- Code level: the tree of executed methods and their durations, in real order. The amount of detail depends on importance and cost: slow parts of a request usually carry more. Durations of remote calls are seen from the client side.
- Logs: log records in the context of the transaction, if log enrichment is on. Strict span filter restricts to the selected node; View logs for this trace shows everything.
- Errors, Threads, Integrations depending on the technology.
The reverse path works too: in an enriched log, the trace_id property is clickable and opens the trace. For the OpenTelemetry equivalent, see linking logs and traces by trace ID.
Diagnosing a slow request in 5 steps
The most common case is still a slow request reported by a user or by a latency SLO. This sequence saves the most time.
- Filter. Open Distributed traces from the entry service (Services > More (…) > Distributed traces), frame the incident timeframe, then Filter requests > Response time, operator ≥, and your threshold (80 ms in the documentation example). If traffic goes through several call chains, set the filter in the service flow first (Apply filter on the called service): the list then only shows requests that follow that chain.
- Sort by duration. Sort the Most recent traces list by Response time, descending. Compare with Processing time: if the first clearly exceeds the second, the time is spent waiting for a remote call, not in the service’s code. If the row says [n] more like this, OneAgent is sampling: the displayed trace stands for similar requests that were not captured.
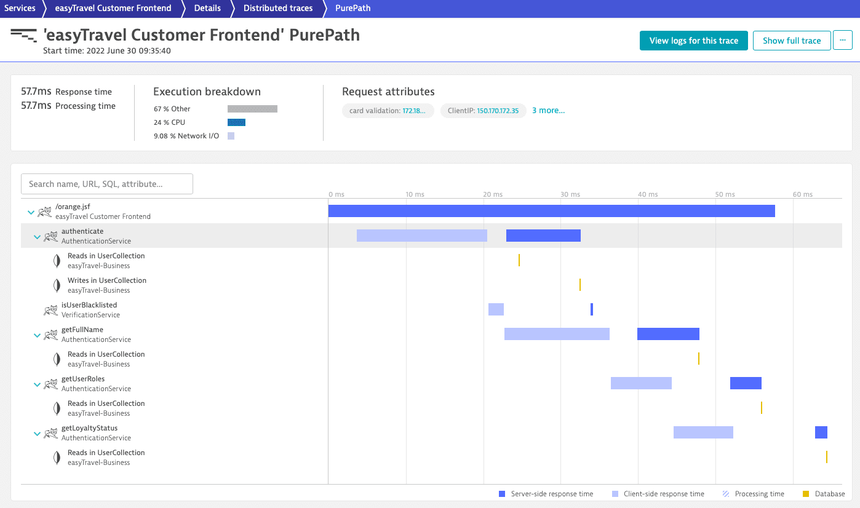
- Open the PurePath. Select the trace name. The header gives Response time, Processing time, the Execution breakdown (share of CPU, Network I/O, “Other”) and the captured request attributes. A high Network I/O share points to outgoing calls; high CPU points to the service code.
- Read the waterfall and the database calls. In the waterfall, each bar is a service call placed on the real time axis: dark blue bars are server-side time, light bars client-side time, and yellow ticks are database calls. Look for the longest bar with no long child: that is where the time goes. The same database call repeated dozens of times in sequence is an N+1; a long client bar with no server counterpart is an external call or a service without OneAgent.
- Go back to the code. Select the guilty segment, Code level tab: the tree of methods actually executed, with their durations, in execution order. For a statistical view (CPU, wait, sync, lock, execution), use Timings > View method hotspots. If code level is empty, check the trace’s age (10 days) and that the process is monitored by OneAgent in full-stack mode.
To find out where those slow requests came from (which application, which caller, which user action), start again from the service with Analyze backtrace: the service backtrace walks the call chain the other way, and its Filter service backtrace option keeps only the transactions that contain the selected chain.
Five concrete scenarios
Slowness felt by users
Filter the entry service on Response time ≥ your objective, open the slowest trace, then Execution breakdown. If the time is in the service itself, go through Timings > View method hotspots; if it is in a downstream call, walk down the waterfall.
Rising error rate
From the service, Failure rate tab, then Analyze backtrace to see where failed requests come from, and More (…) > Distributed traces. The Errors tab gives the exception and the parameters that led to it: often, every trace shares the same cause.
Third-party call
An external call shows up as a long bar with no code level on the called side. Compare client time with total time: if most of it is there, the issue is with the provider, and your timeouts and retries deserve a review.
Database
Database calls appear in the trace waterfall. Look for the same call repeated dozens of times in a single trace: the classic N+1 pattern.
Regression after a deployment
Compare two windows of equal length, before and after the release, on the same service and latency threshold. A request attribute capturing the version (header or parameter) then lets you filter the new version’s traces directly. Remember that non-aggregated code level disappears after 10 days: analyse quickly.
Request attributes: enriching traces through the API
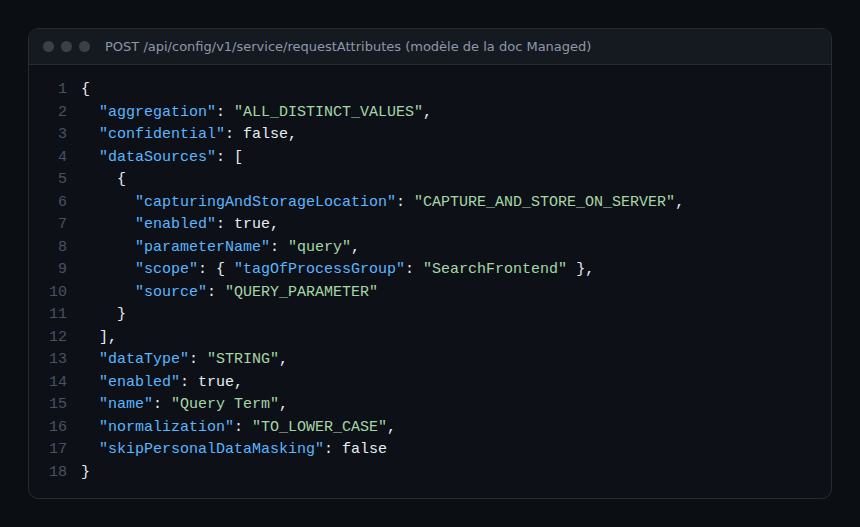
Request attributes are key/value pairs attached to a request. They are used to filter, name requests, detect business errors and create calculated metrics. Create them in Settings > Server-side service monitoring > Request attributes or through the Configuration API, which lets you version them. The model below comes from the Managed documentation:
# list request attributes (ReadConfig scope)
curl -s -H "Authorization: Api-Token $DT_TOKEN" \
  "https://{your-domain}/e/{your-environment-id}/api/config/v1/service/requestAttributes"

# create a request attribute (CaptureRequestData scope)
curl -s -X POST -H "Authorization: Api-Token $DT_TOKEN" \
  -H "Content-Type: application/json" -d @request-attribute.json \
  "https://{your-domain}/e/{your-environment-id}/api/config/v1/service/requestAttributes"
Do not provide an id in the body: it is assigned automatically and returned in the 201 response. source accepts, among others, REQUEST_HEADER, QUERY_PARAMETER, METHOD_PARAM or SPAN_ATTRIBUTE (with spanAttributeKey) for OpenTelemetry traces. Set confidential for any personal data.
Retention and Managed-specific limits
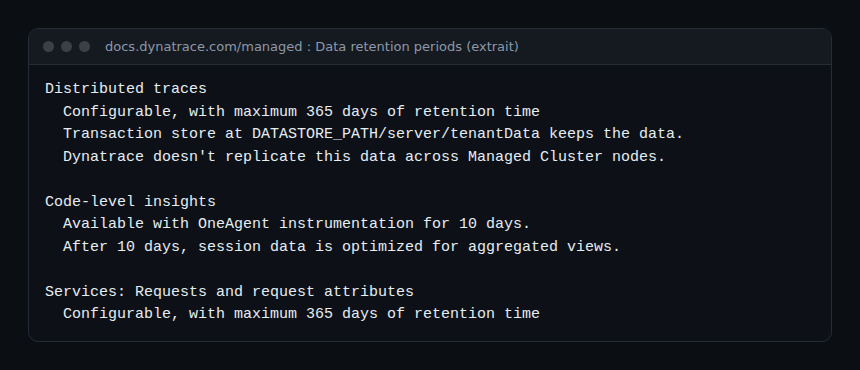
- Distributed traces: configurable retention, 365 days maximum. They live in the transaction store (
DATASTORE_PATH/server/tenantData), not replicated across cluster nodes: lose a node, lose its traces. Details in data retention and storage. - Code-level insights: 10 days in full detail, then aggregated data.
- Requests and request attributes: configurable, 365 days maximum.
- Request attributes: 100 per request, 10 values per attribute per request, at most 1,000 captured attributes per trace; beyond that, nothing more is captured.
- CSV export of the list: 50 traces with “only displayed data”, the 3,000 most recent with “all available data”.
Pitfalls: sampling, incomplete traces, missing request attributes
Sampling (Adaptive Traffic Management)
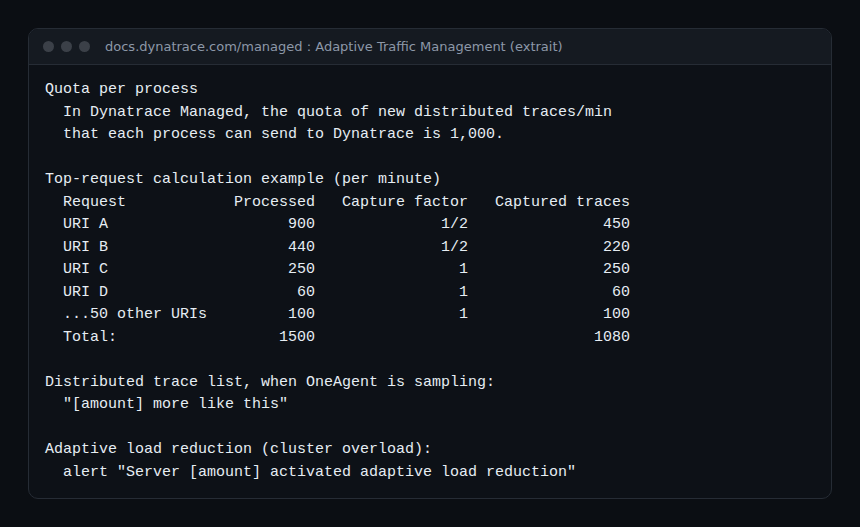
OneAgent does not capture every request. In Managed, each process may start at most 1,000 new distributed traces per minute by default. Beyond that, Adaptive Traffic Management keeps most rare requests and a reduced share of very frequent ones (a 1/2 factor in the documentation example); the list flags uncaptured requests with [n] more like this. A slow but rare request is therefore very likely to be captured; a slow request among thousands of identical calls may be missed. The quota is set in Settings > Server-side service monitoring > Deep monitoring > Adaptive capture control (global or per process group), within the limit set in the Cluster Management Console (environment quota of 1,000 by default, up to 100,000). The Trace sampling for HTTP requests (OneAgent 1.281+) and Trace sampling for RPC requests (OneAgent 1.307+) rules let you prioritise some URLs or disable tracing for known noise (health checks, images). Finally, an overloaded cluster triggers adaptive load reduction: it randomly skips new traces and shows the alert Server [n] activated adaptive load reduction; beyond 15 minutes, data fidelity suffers and you need to add a node or reduce traffic.
Incomplete traces
Three causes cover almost every case. An unmonitored caller: the trace starts at the first fully monitored process group, and Show full trace only shows what exists. Stripped headers: a proxy, WAF or API gateway that removes x-dynatrace, traceparent or tracestate produces two traces instead of one; the documentation also asks you to let X-dynaTrace-RequestState through, used by the Apache, NGINX and IIS modules. A mixed environment: without Send W3C Trace Context HTTP headers, OneAgent and OpenTelemetry do not share the trace ID, and OpenTelemetry traces only appear under Ingested traces, cut off from their upstream. If your OpenTelemetry spans do not arrive at all, follow the checklist for missing OpenTelemetry traces.
Missing request attributes
A request attribute missing from the Summary tab almost always has a configuration cause. The rule is restricted to a process group, host group, technology or tag that is not the one of the observed service. The source is wrong: a header is captured with REQUEST_HEADER and parameterName, a URL parameter with QUERY_PARAMETER, an OpenTelemetry span attribute with SPAN_ATTRIBUTE and spanAttributeKey. The capture side is wrong: for a header, capturingAndStorageLocation must be client or server, never CAPTURE_AND_STORE_ON_BOTH. The limits are reached: 100 attributes per request, 10 values per attribute, 1,000 attributes per trace, beyond which nothing more is captured. Or the attribute exists but its values show as *****: it is marked confidential and your account may not see masked data. Finally, OneAgent captures attributes at request time: traces older than the rule will never carry it, so do not look for a version in yesterday’s traces.
Best practices
- Always filter by service and latency threshold before opening a trace.
- Paste the trace ID into the incident ticket: the trace stays findable by search.
- Create request attributes (version, customer, tenant) before the incident, not during it.
- Check that proxies and load balancers let
x-dynatrace,traceparentandtracestatethrough. - Analyse code level within 10 days; beyond that, export what you need for the post-mortem.
How to check it works
Open Distributed traces, filter on a service with PurePaths: traces should appear with several services in the waterfall. If a trace stops dead at a proxy, check header propagation. After creating a request attribute, the API GET should list it, and the attribute should appear in the Summary tab of new traces. To go further, see the module on exploring Managed data and multidimensional analysis.
Frequently asked questions
What does [declared unavailable by agent] mean in a trace?
It is a placeholder: OneAgent could not capture the metadata, because of limited visibility or because the technology is not supported.
Why does my trace start in the middle of the chain?
A trace always starts at the first fully monitored process group. A caller without OneAgent, or headers stripped along the way, cut off the upstream part. Show full trace displays the complete trace when it exists.
Are OpenTelemetry traces visible in Managed?
Yes, in the same view with the Ingested traces filter. In a mixed environment, turn on W3C Trace Context and avoid duplicate spans (see OneAgent and OpenTelemetry without duplicates).
Conclusion
Dynatrace Managed distributed traces turn “the service is slow” into “this method, on this service, for these requests”. Filter first, read the waterfall next, drill into code and logs last, and keep in mind the 10 days of code level and the non-replicated transaction store. Official reference: Get started with Distributed Traces (Managed) and Data retention periods and Adaptive Traffic Management.
span.observer is an independent community blog, not affiliated with Dynatrace LLC. Dynatrace and PurePath are trademarks of their owner. Examples are provided for guidance only: check them against the official documentation for your version.