
An Elasticsearch circuit breaker is a memory guard: when an operation risks exhausting the JVM heap, Elasticsearch rejects it instead of letting the node run out of memory. The most feared one is the parent breaker. According to the Elastic documentation, it rejects operations when its limit is reached. For an SRE team, that rejection is a useful signal, but it shows up as client errors, so you need to know how to read it.
This article shows how to recognise the error, measure memory pressure, fix the usual causes, then export JVM and breaker metrics to Dynatrace with OpenTelemetry. The content applies to Dynatrace SaaS; the Elasticsearch settings do not depend on Dynatrace.
Elasticsearch circuit breaker: what the parent breaker does
Elasticsearch uses several breakers. Each child breaker watches one kind of consumption (fielddata, requests, in-flight network requests), and the parent breaker watches the total. From the settings page, these are the defaults it lists:
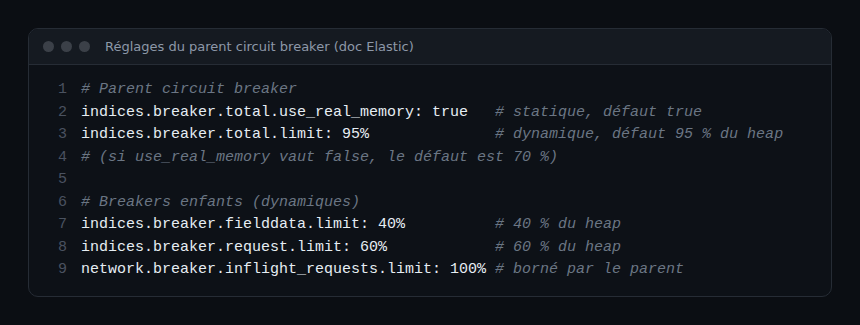
indices.breaker.total.use_real_memory: static setting,trueby default. The parent then accounts for real memory use, not only what child breakers reserve.indices.breaker.total.limit: dynamic setting. Default: 95% of the JVM heap ifuse_real_memoryistrue, otherwise 70%.- Child breakers:
fielddataat 40%,requestat 60%,inflight_requestsat 100% (bounded by the parent limit).
The request breaker covers per-request structures, such as aggregation memory; ES|QL shares it. Remember this above all: the parent trips on the real memory used by the node, so a child breaker can stay under its limit while the parent blocks.
Recognising a CircuitBreakingException
The troubleshooting page describes the error: Elasticsearch answers with HTTP status 429, the error type is circuit_breaking_exception and the reason starts with [parent] Data too large. On the server, elasticsearch.log records a CircuitBreakingException. That last point helps when an automated process, such as shard allocation, trips the breaker without any client seeing an error.
A 429 does not tell you which request caused the saturation: the one that fails is often just the last to arrive. Treat the error as a symptom of memory pressure, not as a defect of the rejected request.
Step 1: measure heap memory pressure
The instantaneous heap follows a sawtooth pattern. The “high JVM memory pressure” page recommends tracking JVM memory pressure, a rolling average tied to old-generation garbage collection. The per-node calculation is jvm.mem.pools.old.used_in_bytes divided by max_in_bytes, times 100. The page gives a jq command run on a saved node stats response. Here is the idea, with example credentials:
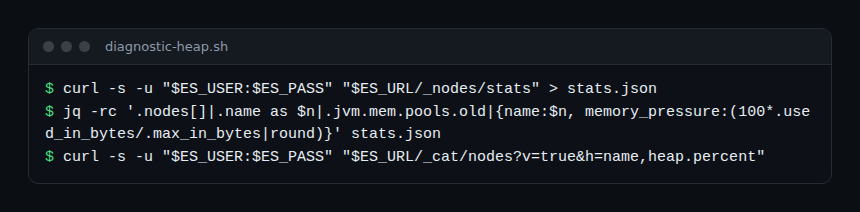
curl -s -u "$ES_USER:$ES_PASS" "$ES_URL/_nodes/stats" > stats.json
jq -rc '.nodes[]|.name as $n|.jvm.mem.pools.old|{name:$n, memory_pressure:(100*.used_in_bytes/.max_in_bytes|round)}' stats.json
The thresholds Elastic cites: the parent breaker trips by default at 95% JVM memory usage, and the documentation advises acting if usage consistently exceeds 85%. On Elastic Cloud, indicators turn red at 75%. The _cat/nodes call with the heap.percent column gives a quick look, but it is an instantaneous percentage.
Step 2: see which breaker tripped
The node stats API exposes, for each breaker, the estimated usage, the limit, the trip count and the overhead factor. Compare the parent’s trip counter with those of the children. According to the troubleshooting page, from version 9.3 a dedicated API, cat circuit breaker, gives tabular output per breaker and per node. The page does not detail the exact request: check the reference for your version before automating it.
Keep in mind a limit the documentation acknowledges: breakers rely on point-in-time estimates. Parallel operations, aggregations, complex queries or non-heap memory (thread stacks) can still cause an out-of-memory condition.
Step 3: fix the usual causes
Before raising a limit, look for the cause. Raising indices.breaker.total.limit moves the problem towards an OOM. The causes and leads Elastic lists:
- Fielddata on a
textfield: disabled by default. If you enabled it, use akeywordfield (multi-field) instead. Otherwise the clear cache API empties the cache, at the risk of disrupting running searches that use it. - Heap size:
Xmsequal toXmx, and no more than half of the system RAM; check compressed OOPs (jvm.using_compressed_ordinary_object_pointers), often lost above roughly 30 GB. - Swap: disable it; check
os.swap.used_in_bytes. - Too many shards or segments: each shard uses memory; fewer, larger shards are usually more efficient. A force merge after writes end reduces segments.
- Expensive searches: enable slow logs, then consider
index.max_result_window,search.max_buckets,search.allow_expensive_queriesorsearch.default_search_timeout(the page gives 5000, 20000,falseand"1m"as examples, not as recommended values). - Oversized bulk and multi-search requests: send smaller requests, spaced further apart.
If the heap stays high despite these fixes, the documentation suggests capturing a heap dump while memory is high, or adding node memory.
Step 4: export JVM and breaker metrics to Dynatrace
The elasticsearch receiver of the OpenTelemetry Collector (contrib distribution, metrics in beta, Elasticsearch 7.9 minimum according to its README) queries the cluster API. Its metrics file lists, enabled by default: elasticsearch.breaker.memory.estimated, elasticsearch.breaker.memory.limit, elasticsearch.breaker.tripped, jvm.memory.heap.used, jvm.memory.heap.max, as well as jvm.memory.pool.used and jvm.memory.pool.max. The jvm.memory.heap.utilization metric exists but is disabled by default. With security enabled, the user needs the monitor or manage cluster privilege.
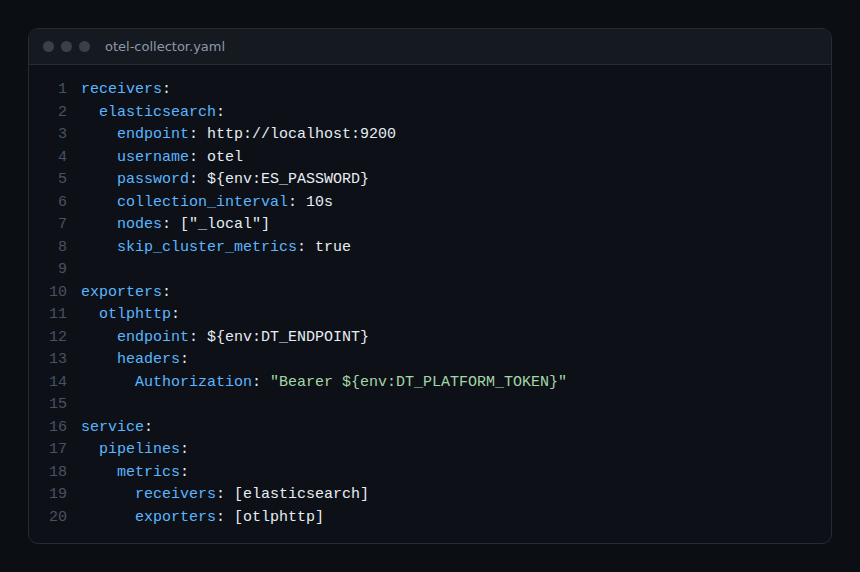
The configuration reuses the README parameters (nodes: ["_local"] for one receiver per node; skip_cluster_metrics set to true avoids duplicate cluster metrics). Sending to Dynatrace, the token and the cumulativetodelta processor are covered in our guide to the Collector with Dynatrace; see also the tutorial on the elasticsearch receiver. Adapt the DT_ENDPOINT and DT_PLATFORM_TOKEN variables and never commit the token.
How to check that it works
- Add the
debugexporter to the pipeline: theelasticsearch.breaker.*andjvm.memory.*metrics should appear in the Collector logs. - In Dynatrace, search for these metric names and build a per-node series; the DQL query is described in the article on DQL timeseries queries.
- Create an alert on a rise in
elasticsearch.breaker.trippedand another on heap usage approaching the 85% threshold Elastic cites. Add a missing-data alert: a node that stops answering stops producing points.
What this changes for an SRE team
A breaker 429 burns error budget on a search or ingestion availability SLI. Set thresholds on the trend of memory pressure rather than on the error, so you act before the rejection. Write the runbook in a blameless way: the failing request is rarely the only culprit. To compare this approach with an integrated solution, see the Dynatrace and Datadog comparison; for the difference between measuring and understanding, see observability versus monitoring.
Best practices
- Fix the cause (fielddata, shards, queries) before changing a breaker limit.
- Track old-generation memory pressure, not only the instantaneous heap.
- Alert before 95%: the documentation suggests 85% as the action threshold.
- Pin the Collector version: the receiver is in beta.
Frequently asked questions
What is the default limit of the parent breaker?
95% of the JVM heap when indices.breaker.total.use_real_memory is true (the default), otherwise 70%, according to the Elastic documentation.
Should I raise indices.breaker.total.limit?
Rarely. The documentation points towards reducing memory pressure. Raising the limit leaves less margin before an out-of-memory error.
Which HTTP code does a tripped breaker return?
A 429 status, with a circuit_breaking_exception error whose reason starts with [parent] Data too large.
In short: the parent breaker protects the node, but it reveals a heap under strain. Measure memory pressure, find the cause, then export the metrics over OTLP to be alerted before the 429.
Official sources: circuit breaker settings, circuit breaker errors, high JVM memory pressure, elasticsearch receiver.
This article comes from an independent blog, not affiliated with Dynatrace LLC or Elastic N.V. Product names belong to their owners; the identifiers and URLs in the examples are fictitious.