

Your log bill doubles every quarter, and nobody reads 90% of what you store. Do you really need to index every word of every line? With Loki log labels, Grafana Labs bets on the opposite: index a few labels per stream, and search the rest at read time. The grafana/loki repository showed about 29,200 stars on 11 November 2026, under the AGPL-3.0 licence.
That choice cuts cost, but it demands discipline. This article starts from the operating decision: which labels to keep, which to refuse, and what to do with values that never stop changing. The facts come from the official documentation and the repository, read on 11 November 2026.
A note on honesty: span.observer did not deploy Loki for this article. The two screenshots are example extracts we wrote ourselves and did not run. To place Loki in a full stack, see our Dynatrace and Grafana comparison.
Why Loki log labels cost less
A full-text engine builds an index over the content of every line. That index grows with volume, and you must store it and keep it in memory. Loki makes a different bet, described in its documentation: it does not index log contents, only metadata in the form of labels for each stream.
- A stream is the unique combination of all the label key-value pairs.
- The lines of a stream are compressed and written to chunks, held in object storage such as S3 or GCS.
- The index only tells Loki where to find the chunks for a given label set.
Object storage is the only data storage mechanism, so Loki inherits its cost and reliability, compared with locally attached disks. For growing log volumes, the saving comes from a small index and compressed chunks.
You pay at read time. Loki first narrows the query to a stream using labels, then scans its lines. A query that cannot narrow the streams reads a lot of data.
The decision: which labels does a stream get?
Everything starts with cardinality, the number of unique label and value combinations. The documentation warns that high cardinality makes Loki build a huge index and flush thousands of tiny chunks to object storage. Each new label value creates a new stream.
Here is the triage I suggest, following the documentation’s recommendations.
- Keep stable, bounded values: region, cluster, namespace, application, environment. A host label with 1,000 values is still acceptable.
- Refuse ephemeral values: trace, order or request IDs, IP addresses, timestamps.
- Refuse labels nobody queries: they grow the index and fragment streams for nothing.
- Be wary of
levelas a dynamic label: a|= "level=error"filter is often just as fast and does not split streams.
Orders of magnitude exist. Dynamic labels should have a handful of values, perhaps tens. Loki applies a default limit of 15 index labels, and the documentation advises at most 10 to 15 custom labels.
The painful case: a request ID as a label
The documentation gives a telling example. An analysis with logcli series --analyze-labels showed a requestId label with 24,653 unique values across 24,979 streams. The guide calls it a perfect example of something that should not be a label.
The fix is to drop the label and filter inside the line, for example with |= "requestId=32422355". The stream stays single, chunks fill up, and search stays reasonable if the selector is tight.
A second effect is less visible. With too many streams, chunks are written before they are full, because of idle timeouts or maximum age. The result is a swarm of small chunks. The loki_ingester_chunks_flushed_total metric, grouped by reason, shows why they leave.
One more constraint: within a stream, entries must arrive in order, inside a default two-hour window. Beyond that, Loki rejects the line with a “too far behind” error. Giving two sources distinct labels keeps them out of the same stream.
Structured metadata: keep the value without indexing it
What about a pod, thread or process ID, useful but never stable enough to be a label? The documentation offers structured metadata: metadata attached to the line, neither indexed nor placed in the text. It recommends it notably for OpenTelemetry data received through Grafana Alloy or an OpenTelemetry Collector. For Alloy, see our article on the collector that replaces Promtail.
It has precise prerequisites:
- schema version 13 or later (chunk format V4);
- the
tsdbindex: the deprecatedboltdb-shipperdoes not support it; allow_structured_metadata: trueunderlimits_config.
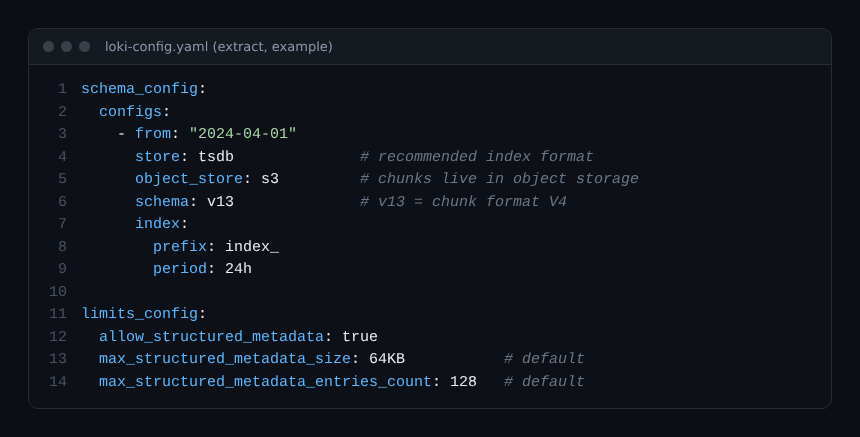
The defaults are 64 KB and 128 entries per line. Beyond that, the line is rejected with an HTTP 400 error. At read time, these values show up as labels on the result and are filtered the same way. Beware: in a metric query they can blow up the number of series. The keep or drop stages remove what you do not need.
The documentation I read does not say which Loki release introduced the feature, so I do not state it.
Querying with LogQL
A LogQL query has two parts: a mandatory stream selector, then an optional pipeline. The selector uses the =, !=, =~ and !~ operators. The pipeline chains line filters (|=, !=, |~), parsers such as json or logfmt, then filters on the extracted fields.
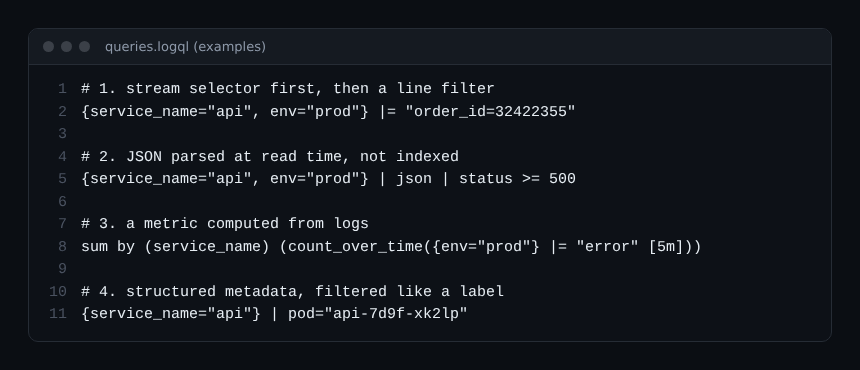
The practical rule: a narrow selector first, then a line filter, then a parser. Parsing is costly across many lines; the selector is not. For a different take on log analysis, see log pattern analysis.
The AGPL-3.0 licence: what it requires
The repository README says Loki is distributed under AGPL-3.0-only, and the LICENSE file holds the text of the GNU Affero General Public License, version 3. I found no exception in that file.
What sets the AGPL apart is section 13: if you modify the software and users interact with it remotely, you must offer them the source of your modified version. For internal use without modification, the obligation is generally seen as light. This reading is not legal advice: have your case checked, especially if you modify Loki or offer it as a service. I did not check the terms of Grafana Labs’ commercial offerings.
Best practices
- List the labels your queries actually use, and delete the others.
- Measure cardinality before going live with
logcli series --analyze-labels. - Move high-cardinality values to structured metadata, after checking the schema and index.
- Watch chunk flush reasons and active streams per tenant.
- Keep selectors narrow: they bound the read cost.
- Re-read the AGPL before modifying the code or exposing it to third parties.
Frequently asked questions
Is Loki really cheaper than a full-text engine?
The documentation says so for operations, thanks to a small index and compressed chunks in object storage. I did not measure the gain: it depends on your volume, labels and queries.
Can I search a value that is not a label?
Yes, with a line filter, a parser, or structured metadata. The search then scans the lines of the selected streams, so a precise selector stays essential.
What limit should I not exceed?
For very large tenants, the documentation gives as a guide fewer than 100,000 active streams and fewer than 1 million streams over 24 hours. A smaller tenant should scale down proportionally.
Conclusion
Loki makes logs cheap if you accept one simple rule: few labels, stable ones, chosen for your queries. What varies goes in the line or in structured metadata. Repository and documentation: grafana/loki and grafana.com/docs/loki.
span.observer is an independent community blog, not affiliated with Dynatrace LLC or Grafana Labs. Trademarks belong to their owners. Tools change quickly: check commands and options in the official documentation.