A Datadog composite monitor combines several existing monitors into a single alert, using a Boolean condition. It avoids duplicating queries and cuts noise: instead of paging the on-call engineer for one isolated error, you alert only when several signals are true at the same time. This article summarises the official documentation, with a step-by-step guide and the pitfalls. It does not cover pricing, which we have not verified.
The content is about Datadog; the link to Dynatrace comes at the end, without claiming an equivalence we have not verified.
Datadog composite monitor: what it is and what it is not
According to the official composite monitor page, you pick existing monitors (called constituents) and write a condition such as a && b. The composite triggers when the current values of the constituents make the condition true at the same time.
- Up to 10 constituent monitors, simple alert, multi alert or a mix.
- A constituent cannot itself be a composite: no composites of composites.
- The composite has its own notification policy; deleting a composite does not delete its constituents.
- Several composites can reference the same monitor, so you reuse rather than duplicate.
For an SRE team the benefit is twofold: fewer queries to maintain, and alerts closer to a real symptom. It follows the same thinking as our article on observability versus monitoring: alert on what matters to the user.
Operators and status logic
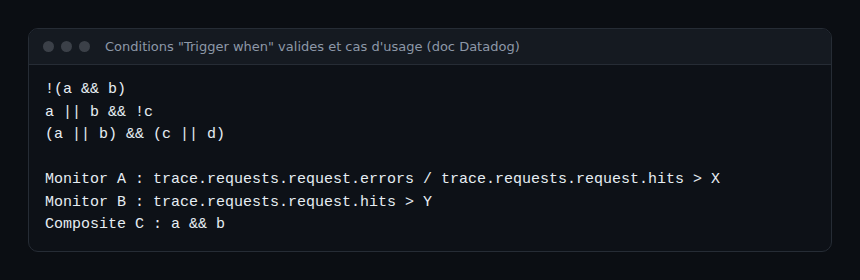
The condition uses the labels a, b, c… and the operators &&, || and !, with parentheses for precedence. Here are three valid examples from the documentation, then a use case.
The Alert, Warn and No Data statuses all count as alert-worthy; only Ok does not. The documentation spells out the severity rules.
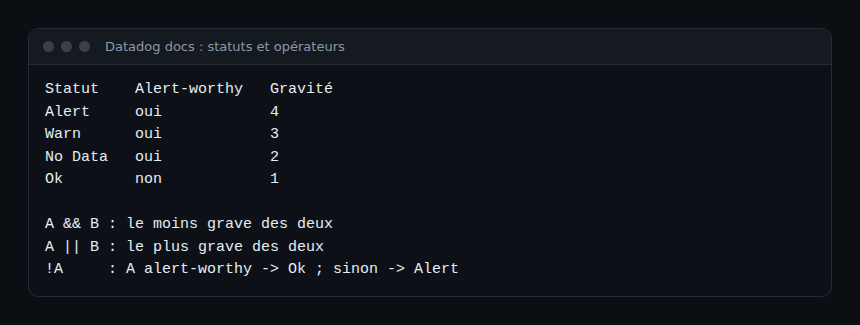
A && B: if the condition is alert-worthy, the result is the least severe of the two.A || B: the result is the most severe of the two.!A: if A is No Data, the result stays No Data; if A is alert-worthy, the result is Ok; otherwise Alert.
Example from the truth table: A in Alert and B in Warn give a composite in Warn with &&, but in Alert with ||.
Create a composite monitor step by step
Prerequisites
You need two existing non-composite monitors with common groupings. We found no version restriction in the documentation.
Steps in the interface
- Open Monitors, then New Monitor, then Composite.
- Choose the first monitor: the interface shows its alert type and status. For a multi alert monitor, it also shows the group-by clause and the number of sources (for example “Returns 5 host groups”).
- Add a second monitor with compatible groups. The interface warns you if the groups differ.
- The Trigger when field defaults to
a && b. Edit it if needed. - Set notifications and advanced options, then save.
Create the composite through the API
The API documentation states that the type is composite and that the query references the IDs of non-composite monitors, for example 12345 && 67890. The composite page example uses 1234 and 5678.
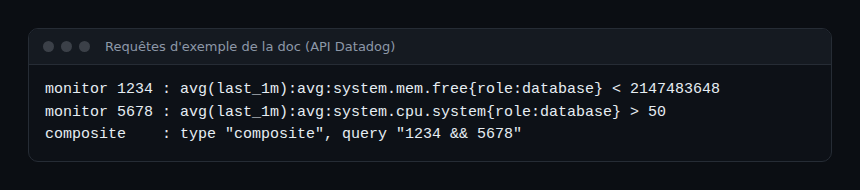
We did not run these calls: the example comes from the documentation. Check the required fields in the Monitors API reference before automating.
Use cases from the documentation
The use cases page offers simple patterns:
- Error rate with meaningful traffic: A = error rate above a threshold, B = request count above a threshold, composite
a && b. This avoids alerts on three requests of which one fails. - Latency and low traffic: ignore overnight spikes by also requiring a minimum volume over one hour.
- Paired event:
a && !balerts when a “create” arrives without a “resolve”. - Notification delay: one monitor on the real-time metric and another on the same metric shifted with
timeshift, so you alert only when the error persists.
These patterns reduce on-call toil: fewer false positives, so MTTR and alert fatigue are easier to manage. To measure the effect, compare the number of pages before and after, using your own data.
Pitfalls: groups, No Data and downtimes
Common groupings
Without a common source, the composite may never produce a result. The interface then shows a Group Matching Error, and you can still create the monitor, which will never trigger. Matching uses tag values, not keys: service:web04 matches host:web04. If A reports web01 to web05 and B web04 to web09, only web04 and web05 count.
No Data
The composite’s “Notify no data” setting does not change those of the constituents. To alert on No Data, the constituents and the composite must be set to notify. With the option off, a No Data result is replaced by the last known state.
Downtimes
A downtime on the composite mutes only its own notifications; the constituents keep notifying. Conversely, a downtime on a constituent does not mute the composite. Schedule both if you want complete silence.
Notification variables
According to the notification variables page, a composite can read the value and status of each constituent through the variables a.value and a.status (inside double curly braces in the message). Tag variables work if the constituents are grouped by the same tag.
Best practices
- Keep constituents simple and clearly named: a composite becomes unreadable beyond a few labels.
- Align groupings (
host,service) before creating the composite. - Test the condition against the documentation’s truth table before turning off older alerts.
- State in the message which constituent fired, using the
a.statusvariables. - Version composites in your infrastructure-as-code tool rather than by hand.
What about Dynatrace and OpenTelemetry?
A composite monitor has no link to OpenTelemetry: it acts on Datadog monitors already defined, whatever the origin of the data. If you send OTLP, see our guides on DDOT and the Collector on Kubernetes. For an overview of both platforms, read the Dynatrace and Datadog comparison. We have not verified an exact Dynatrace equivalent of the composite here: the goal is the same (correlate several conditions before alerting), but compare the mechanisms yourself.
Frequently asked questions
How many monitors can a Datadog composite monitor combine?
The documentation says up to 10 constituent monitors, which cannot themselves be composites.
Why does my composite never trigger?
Often because the constituents share no groups: the interface shows a Group Matching Error. Also check the No Data settings.
Does a downtime on a constituent mute the composite?
No. According to the documentation, the composite keeps alerting; you need to set a downtime on the composite itself.
Conclusion
The composite monitor combines existing signals with &&, || and !, without duplicating queries. Take care over common groups, No Data settings and downtimes, and you get more targeted alerts.
Sources
- Composite monitor, Datadog documentation
- Composite monitor use cases, Datadog documentation
- Notification variables, Datadog documentation
- Monitors API, Datadog documentation
span.observer is an independent blog, not affiliated with Dynatrace LLC or Datadog Inc. Product names belong to their respective owners. Content based on the Datadog documentation consulted on 30 October 2026; check the current version before any production use.