



An authorisation token shows up in a log attribute, a metric arrives under a name nobody recognises, and health checks inflate the trace bill. Three problems, one answer inside the Collector: OTTL OpenTelemetry, the language that lets you fix telemetry in flight, before it leaves for the backend.
This article starts from those three operating decisions rather than from a function catalogue. What must be masked, what must be renamed, what must be thrown away? Each answer fits in a few statements. For the big picture of components, see the article on Collector contrib components. Here we stay on the language itself.
The facts come from the “Transforming telemetry” page on opentelemetry.io and from the opentelemetry-collector-contrib READMEs (pkg/ottl, transformprocessor, filterprocessor), read on 12 November 2026. Processing happens in the Collector, before the OTLP export, so the reasoning holds for Dynatrace SaaS, for Dynatrace Managed and for any other backend.
Reading an OTTL statement in thirty seconds
An OTTL statement has a function and, optionally, a condition. The function changes the telemetry. The condition, introduced by where, decides whether the function runs. The README example fits on one line: set(span.attributes["test"], "pass") where span.attributes["test"] == nil.
The first argument is a path to a field: span.attributes, resource.attributes, log.body, metric.name. The prefix names the context. The README lists the resource, scope, span, span event, span link, metric, datapoint, exemplar and log contexts. One point to remember: OTTL does not support cross-signal interactions. Copying a log body into a span attribute is rejected.
Two families of functions exist. Editors change the data (set, delete_key, replace_pattern, keep_keys, truncate_all). Converters compute a value and start with a capital letter (SHA256, IsMatch, Concat, Substring, ParseJSON). The language is used in several places: the transform processor, the filter processor, tail sampling and the routing connector.
Masking: remove the secret before the export
After a leak, the first reflex is to delete the offending key, then clean up what remains in the text. The transform processor takes lists of statements per signal (log_statements, trace_statements, metric_statements). The log configuration below drops a header, masks a password in the body and swaps an identifier for its hash.
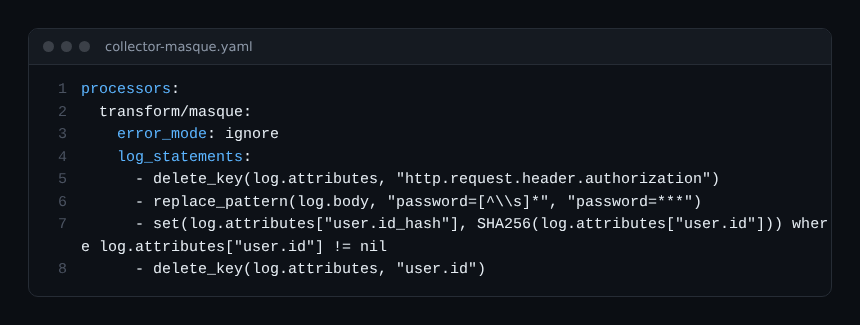
delete_keyremoves thehttp.request.header.authorizationattribute. This is the documentation’s own example.replace_patternreplaces anypassword=…sequence in the body withpassword=***. It assumes a string body: on a structured body, test before relying on it.setwithSHA256writes the hash ofuser.idinto a new attribute, only when the attribute exists.- The last
delete_keythen removes the original value.
Be careful with the word “masking”. A SHA-256 hash lets you correlate one user’s events without seeing the identifier. But if the identifier is short or predictable, anyone can recompute the hash of every possible value. This is general reasoning, not a promise from the documentation: for regulated data, prefer deletion.
On the Dynatrace side, masking also exists at ingestion, with platform features of their own, described in the article on masking in OpenPipeline. The two approaches are not interchangeable: this one acts inside the Collector, the other after the data has arrived.
Renaming: align names with your conventions
Renaming serves one purpose: the same data should carry the same name everywhere, for instance to follow the semantic conventions. In the excerpts I read, OTTL has no dedicated “rename” editor, so you combine two moves. Copy the value to the new name, then delete the old one. For a metric name, replace_pattern works directly on metric.name.
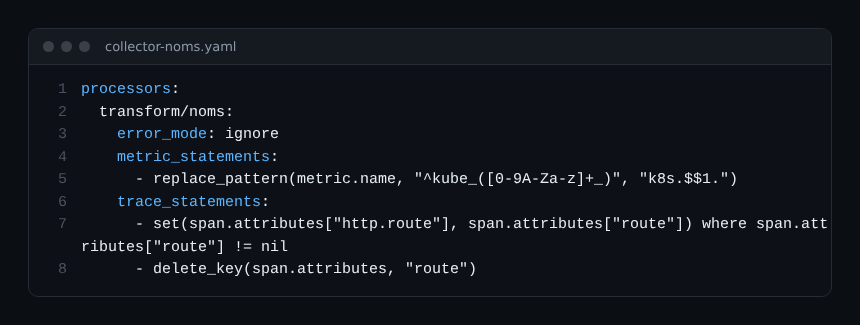
The first statement comes from the README: it turns kube_pod_… into k8s.pod…. Note the $$1. In a Collector configuration file, the dollar sign is used for variable expansion, hence the doubling to get a capture group. Without it, the reference is interpreted before it reaches OTTL.
The second pair moves the route attribute to http.route. Order matters: the copying statement must come before the deleting one, otherwise the value is gone before the copy. Statements run in the order they are written.
The opentelemetry.io page also presents the metricstransform processor, which renames metrics and labels with regular-expression matching. That is another route, with its own syntax. Pick one tool per transformation, so the next reader knows where to look.
Filtering: drop the noise, but not blindly
The filter processor also uses OTTL, but with conditions rather than statements. The reading rule is counter-intuitive: a condition that is true makes the data dropped. Several conditions in one list are combined with OR: a single match is enough. Inside a condition, and, or and parentheses are allowed.
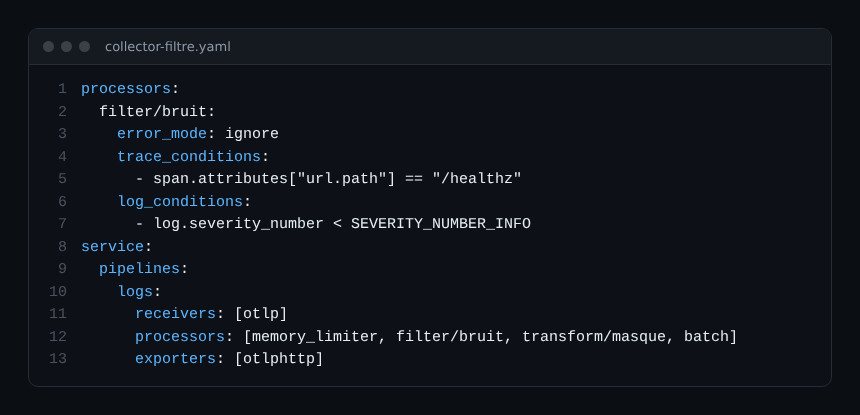
The configuration above discards /healthz spans and logs below INFO, then places the filter in the pipeline. The filter README flags several side effects:
- when a span is dropped, its span event conditions are skipped;
- if all the span events of a span are dropped, the span is kept;
- if all the datapoints of a metric are dropped, the metric is dropped too;
- dropping spans can leave orphaned child spans or logs.
One more nuance: the README describes the current format (trace_conditions, log_conditions, metric_conditions) and says the older traces.*, metrics.* and logs.* options are deprecated. The opentelemetry.io page still shows the old form. To decide which traces to keep based on their whole content, a filter is the wrong tool: see the tail sampling rules.
Running OTTL OpenTelemetry in production
Three settings prevent unpleasant surprises.
- Choose the
error_mode. The values areignore(default: the error is logged and the next statement runs),silent(no log) andpropagate(the error bubbles up and the batch is dropped). For masking,propagateis defensible: better to lose a batch than to export a secret. A statement group can override the global value. - Order the processors. They apply in pipeline order. Filter first, so you do not transform what will be thrown away, and mask before any export.
- Switch on debug logging to understand a result. With
service.telemetry.logs.levelset todebug, the Collector prints each statement, whether its condition matched and the state of the context after execution.
For richer cases, the advanced format of the transform processor groups statements with their own context, conditions and error_mode. Statements that mix incompatible paths or functions fail at load time, and must then be split into groups. The README gives the example of convert_sum_to_gauge() with a datapoint path.
Best practices
- Add a
wherecondition to each statement so it only touches the relevant data: the README recommends this for performance, and the opentelemetry.io page warns that advanced transformations can noticeably degrade it. - Test on a staging pipeline with the debug exporter before production.
- Keep masking rules in a single versioned file, reviewed like code.
- Measure before and after: exported volume, pipeline latency, Collector memory. No figure is guaranteed here.
- Check stability: the README marks traces, metrics and logs as stable, while profiles are still in development.
Frequently asked questions
Does OTTL replace the attributes and resource processors?
Not necessarily. Those processors, presented on opentelemetry.io, cover simple cases (insert, update or delete an attribute) with a declarative configuration. OTTL becomes useful as soon as you need a condition, a computation or a regular expression. Mixing both on the same field makes review harder.
Can the transform processor delete a span?
The sources I read describe no deletion function in transform: that is the filter processor’s job. I did not check whether a recent version allows it some other way; the documentation of your version is the reference.
How do I find out why a statement does not apply?
Set the Collector log level to debug. Each statement is printed with the result of its condition. Then check the context prefix of the path: a log path in a traces pipeline will not work.
Conclusion
OTTL OpenTelemetry boils down to one pattern: a function, a path, a condition. Mask what must not leave your network, rename to align your conventions, filter the noise, and set error_mode according to the risk. Reference: the OTTL package README and the Transforming telemetry page.
span.observer is an independent community blog, not affiliated with Dynatrace LLC. Trademarks belong to their owners. The examples are fictional and have not been run in a Collector: check the options in the official documentation for your version.