
An Elasticsearch cluster turns yellow, indexing rejections climb, and nobody knows whether shards, memory or one oversized index is to blame. This tutorial covers Elasticsearch OpenTelemetry monitoring with the Collector: the elasticsearch receiver queries the cluster API and produces OTLP metrics, which you then send to Dynatrace or another backend.
Goal: in six steps, scrape cluster health, nodes and a few indices while keeping cardinality under control. Each metric feeds a concrete SLI: cluster availability, write rejections, search time.
Scope: the receiver is marked beta (metrics only) and ships in the contrib Collector distribution. This applies to Dynatrace SaaS; for Managed, adapt the endpoint (see the Collector to Dynatrace guide).
Prerequisites for Elasticsearch OpenTelemetry monitoring
- Elasticsearch 7.9 or later (minimum version stated in the receiver README). Some metrics need more:
elasticsearch.indexing_pressure.memory.limitrequires 7.10,elasticsearch.cluster.state_update.countrequires 7.16.0. - A contrib Collector (the receiver is not in the core distribution). See the Collector contrib components.
- If Elasticsearch security is on: a dedicated user with the
monitor(ormanage) cluster privilege. - A destination OTLP endpoint and a metrics ingest token.
Step 1: create a read-only user
According to the Elasticsearch documentation, monitor grants all read-only cluster operations; manage adds operations that change the cluster. For a collector, monitor is enough, per the receiver README. Create a role with that single privilege:
PUT /_security/role/otel_monitor
{
  "cluster": ["monitor"]
}
Then attach the role to an otel user (through Kibana or the “Create or update users” API; its exact request shape is not detailed here). Creating a role itself requires the manage_security privilege.
Step 2: declare the receiver
All settings are optional. Here is a cautious configuration based on the README example:
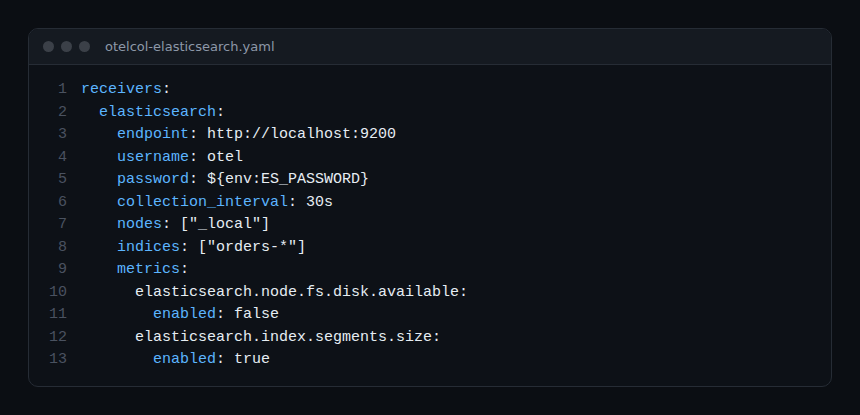
The lines that matter:
endpoint: the API URL,http://localhost:9200by default.usernameandpassword: basic authentication only; the two fields go together. The password comes from an environment variable, never from the file.collection_interval:10sby default; the README notes that larger clusters may need longer. Here, 30 s.nodes: ["_local"]: the value the README gives when you run one receiver per node. The default is["_all"].indices: filter of scraped indices,["_all"]by default.metrics: enables or disables each metric by name.
Step 3: control cardinality by filtering indices
Index metrics carry the index as a dimension. With hundreds of daily indices, the number of series explodes. Three levers exist, all from the README:
indiceswith patterns (orders-*) to follow only useful indices; an empty list disables index metrics.index_stats_master_only: true:/_statsis queried only on the elected master, which avoids duplicates when you run one receiver per node.cluster_stats_master_only: true: same logic for/_cluster/stats. During a master election, nothing is collected until a new master is elected.
If you run one receiver per node, combine nodes: ["_local"] with these two master-only options. If a single Collector queries the whole cluster, keep _all.
Best practices
- One user per collector,
monitorprivilege only. - Filter indices by pattern from day one: trimming later is harder.
- Disable metrics nobody uses, enable optional ones when needed.
- Lengthen
collection_intervalbefore adding capacity to the cluster.
Step 4: pick the useful metrics
The receiver documentation (documentation.md) lists the metrics and their units. A few are enough for a first dashboard:
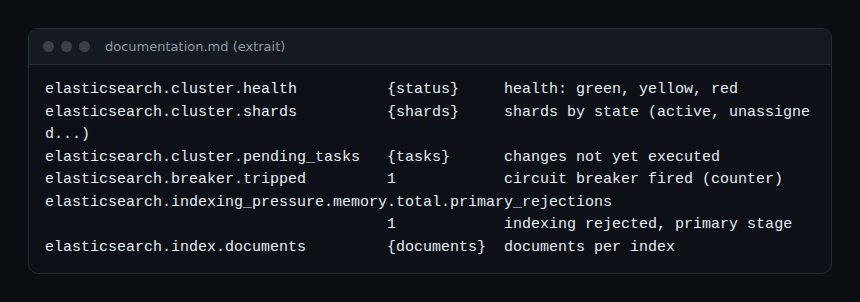
elasticsearch.cluster.health carries a status attribute (green, yellow, red): the basis of an availability SLI. elasticsearch.cluster.shards separates active, relocating, initializing and unassigned shards. Several metrics are optional and off by default, such as elasticsearch.process.cpu.usage or jvm.memory.heap.utilization: turn them on with enabled: true.
Step 5: send the metrics to Dynatrace
Add the OTLP HTTP exporter and a metrics pipeline. According to the Dynatrace documentation, the exporter reads the endpoint and a platform token from environment variables, with an Authorization: Bearer header; the scope cited for OTLP metrics ingest is openpipeline:metrics:ingest.
exporters:
  otlphttp:
    endpoint: ${env:DT_ENDPOINT}
    headers:
      Authorization: "Bearer ${env:DT_PLATFORM_TOKEN}"

service:
  pipelines:
    metrics:
      receivers: [elasticsearch]
      processors: [batch]
      exporters: [otlphttp]
Note: these metrics are cumulative sums (receiver documentation). Our Collector guide recommends the cumulativetodelta processor for Dynatrace; check this in the documentation for your version (not re-verified here). To monitor the Collector itself, see monitoring the OpenTelemetry Collector.
Step 6: how to check that it works
- Start the Collector with the
debugexporter added to the pipeline:elasticsearch.*metrics should show up in the logs. - A 401 or 403 means a wrong user or privilege; check
monitor. - No index metrics: your
indicespattern matches nothing, or the list is empty. - In Dynatrace, search for the
elasticsearch.prefix in the Metrics browser or with a DQL timeseries query.
What this means for an SRE team
The receiver is still beta: names and attributes may change between versions. The README also says Elasticsearch is expected to be instrumented directly with the OpenTelemetry Java SDK one day. Pin the Collector version, test upgrades and alert on missing data, not on thresholds alone. To compare this approach with an integrated product, see the Dynatrace vs Datadog comparison.
Frequently asked questions
Which Elasticsearch versions does the receiver support?
The README says 7.9 and later. Some metrics need a newer version, for example 7.10 or 7.16.0.
Which privilege does the user need?
The monitor or manage cluster privilege. monitor is enough for reading and follows least privilege.
Is the receiver stable?
No: it is marked beta for metrics. Test each Collector upgrade before rolling it out.
Conclusion: one receiver, a monitor user, index filters and an exporter are enough to follow health, shards and indexing pressure. Watch cardinality and the beta status.
Official sources: elasticsearch receiver README, Dynatrace OTLP API.
This article comes from an independent blog, not affiliated with Dynatrace LLC or Elastic N.V.