




Your latency SLO says “99% of requests under 200 ms”, yet the buckets were picked two years ago: 0.1, 0.25, 0.5, 1. Nobody remembers why. Prometheus native histograms take that decision out of the code: resolution becomes a scrape-time setting, not an instrumentation choice. This article starts from that operational choice, then looks at what changes for cardinality, percentiles and SLOs.
Facts come from the official Prometheus specification and documentation, read on 12 November 2026. I ran no benchmark: any storage or CPU gain I cannot cite is flagged as unverified. This piece covers Prometheus and its open source ecosystem only.
For metric cardinality in general, see the article on exploding series; here we only cover what histograms change.
The problem: buckets frozen before you saw the traffic
A classic histogram is a set of series: one _bucket series per le bound, plus _sum and _count. You hard-code the bounds. Too few and the percentile gets coarse. Too many and every bound multiplies the series, then every label (route, status code, pod) multiplies them again.
Worse, the bounds cannot change on the fly. Fixing a poor layout means a deployment, and history from before the change is no longer comparable. The percentile itself is an estimate: Prometheus interpolates inside the bucket that holds the quantile.
What a native histogram does
A native histogram is exposed and stored as one structured sample: count, sum and a dynamic set of buckets. No more series per bound. Bounds follow a geometric progression set by one integer, the schema.
- For a standard schema
n, the upper bound of bucketiis(2^(2^-n))^i. Each bucket is the previous one times a constant factor. - Standard schemas run from -4 to +8; schema -53 is reserved for custom buckets (see below). Schema
nhas half the resolution of scheman+1, so neighbouring buckets can be merged to lower the resolution without losing data. - Empty buckets cost nothing: the representation is sparse and covers the whole float64 range.
- A “zero” bucket collects zero or near-zero values (instrumentation default threshold: 2^-128).
Here is the arithmetic on a concrete case, a latency between 1 ms and 10 s. The script is my own calculation from the formula above, run for this article; the “max relative error” is my estimate, not a figure from the documentation.
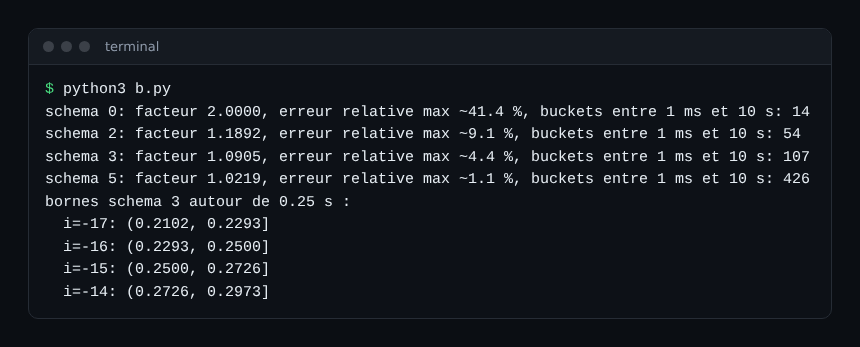
Reading it: at schema 3 (factor 1.09), covering the whole range takes at most 107 buckets, and only those receiving observations exist. Real latency fills a fraction of them. Hand-writing such a layout with classic bounds is almost never done.
Prometheus native histograms and cardinality: what really changes
Two effects, not to be confused with cardinality in general.
- The
lelabel goes away. A classic histogram with 12 bounds produces 14 series per label combination (12 buckets,_sum,_count). The native histogram produces one. That count is arithmetic; the real memory and disk saving depends on your data and I have no measurement to quote. - Business labels remain your problem. Add
user_idto a histogram and you still create one series per user, native or not.
Prometheus also offers guard rails. native_histogram_bucket_limit caps the buckets per histogram: beyond it, resolution drops for standard schemas. native_histogram_min_bucket_factor sets a minimum growth factor. On the client library side, the specification recommends a maximum bucket count, with 160 given as a typical value.
Switching collection on without breaking what exists
Timing matters: experimental from v2.40.0 (November 2022), stable since v3.8.0 according to the specification. Scraping requires scrape_native_histograms; the documentation says that in v4 it defaults to true, as does send_native_histograms for remote write. Do not rely on that future default: write the option out.
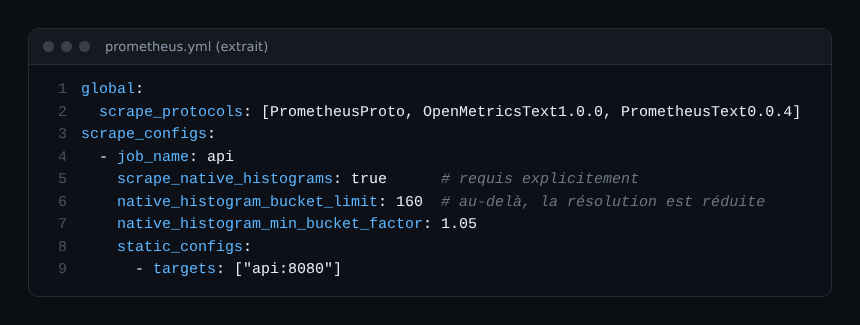
Two points to watch:
- Native histograms travel only in protobuf; the text format is not extended. Enabling the option therefore shifts negotiation to protobuf. The documentation notes that text scrapes are generally much lighter on resources than protobuf scrapes: measure on your own targets.
- By default Prometheus prefers the native part over the classic part.
always_scrape_classic_histograms(false by default) keeps both during migration, at the price of duplicate series.
The client libraries concerned are, according to the metric types documentation, Go and Java. For other languages, check the state of your library before planning.
Percentiles: exact? No, but better spread
The query barely changes, and the le clause disappears. Here are both forms side by side, taken from the documentation examples and adapted to my metric name.
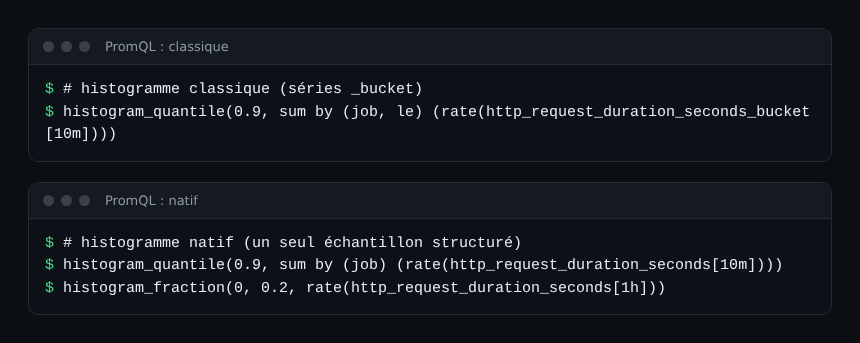
On a native histogram with standard buckets, histogram_quantile interpolates exponentially inside the bucket, as if the observations filled a histogram of finer resolution. Classic histograms and custom buckets use linear interpolation. The documentation gives no numeric error bound for this function. My estimate: with a factor of 1.09, the maximum relative deviation is around 4% at worst; that is a calculation, not a guarantee.
What about existing classic histograms with unsuitable bounds? The convert_classic_histograms_to_nhcb setting converts them on ingestion into custom buckets (schema -53). They keep their bounds, cannot be merged when the bounds differ, and exceeding native_histogram_bucket_limit fails the scrape. It is a bridge, not a destination.
Latency SLOs: the threshold is no longer a bound
With a classic histogram, an “under 200 ms” SLO is computed cleanly only if le="0.2" exists. That is why we add bounds at commitment thresholds. With a native histogram, histogram_fraction(0, 0.2, …) returns the share of observations between 0 and 0.2 s, even when 0.2 is not a bound.
Careful: if 0.2 falls inside a bucket, the result is interpolated. The documentation states that the error depends on the histogram resolution. At schema 3, the bounds around 0.25 s are 0.2293, 0.2500 and 0.2726; 0.2 is not one of them. For a contractual SLO, keep a fine enough schema and check the deviation on a known sample before switching your alerts.
For the rules that precompute these ratios, see Prometheus recording rules. If you compare with how other platforms aggregate distributions, the article on histograms and OpenPipeline covers a different tool; I do not mix the two here. To place Prometheus against OpenTelemetry, read this comparison.
Best practices
- Migrate one service at a time, with
always_scrape_classic_histogramswhile you compare percentiles. - Set a
native_histogram_bucket_limitto bound memory. - Rewrite dashboards and alerts:
histogram_quantilewithoutle,histogram_fractionfor SLOs. - Keep labels low-cardinality: a native histogram does not protect them.
- Check remote storage support (remote write, long-term backend) before migrating: I did not verify it for each backend.
Frequently asked questions
Do Prometheus native histograms replace classic histograms?
Not immediately. The documentation recommends preferring them where the library supports them, but both coexist, and conversion to custom buckets exists for the transition.
Do I still need to choose buckets?
Not at instrumentation: you pick a growth factor and a bucket cap. The instrumentation default factor is 1.1. Custom buckets remain possible, with their merging limits.
Will my percentile be more accurate?
It depends on the schema and your data. Resolution is usually much finer than with a dozen hand-picked bounds, but the documentation does not quantify the error: test on your own distributions.
Conclusion
Native histograms move a decision from code to configuration: you set a resolution and a cap, not a list of bounds. Bucket cardinality disappears, label cardinality does not, and SLOs gain flexibility at the price of an interpolation you must watch. Sources: native histograms specification, PromQL functions.
span.observer is an independent community blog, not affiliated with Dynatrace LLC or the Prometheus project. Trademarks belong to their owners. Versions and options change quickly: check them in the official documentation.