EDOT Kubernetes means running Elastic’s OpenTelemetry distribution (EDOT) on a cluster, driven by the OpenTelemetry Operator. According to Elastic’s documentation, installation goes through the opentelemetry-kube-stack Helm chart and a values file published in the elastic/elastic-agent repository. This tutorial follows that procedure, then explains what the Operator deploys for you and what it leaves to you.
The problem for SRE and platform teams: instrumenting twenty services by hand, one SDK at a time, does not scale. The goal here is to get collectors on every node and annotation-driven auto-instrumentation with a handful of commands. This content is about Elastic and does not depend on Dynatrace SaaS or Dynatrace Managed, but the Operator logic is the same as in our guide to the OpenTelemetry Operator and auto-instrumentation.
At a glance
- Installation takes four commands: Helm repository, namespace, secret,
helm install. - Elastic’s values file declares three collectors: a daemon (DaemonSet), a cluster collector and a gateway.
- Auto-instrumentation relies on an
Instrumentationresource namedelastic-instrumentationand a namespace annotation. - The Operator does not choose your resources, quotas or sampling strategy: those settings remain yours.
Prerequisites for EDOT Kubernetes
According to Elastic’s quickstart for self-managed Kubernetes, you need Helm 3.9 or later, up to and including 4.3.0. The page lists no other prerequisite. You also need kubectl access to the cluster, your Elasticsearch endpoint URL and an Elastic API key. Those two values go into a secret: never write them in a versioned file.
Versions quoted by the documentation when read: chart opentelemetry-kube-stack 0.16.0, values file from the Elastic Agent tag v9.5.5. Check the page before installing, as these numbers change.
Install the OpenTelemetry Operator with the Helm chart
Here is the sequence from Elastic’s documentation, with example values to replace.
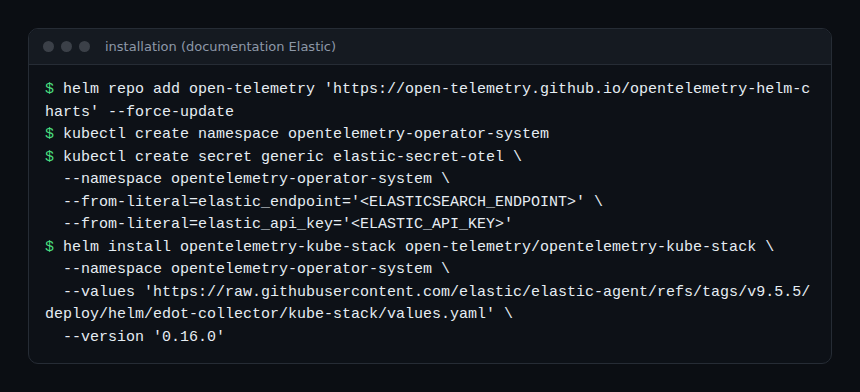
- Add the OpenTelemetry Helm repository with
helm repo add. - Create the namespace
opentelemetry-operator-system. - Create the secret
elastic-secret-otelwith the keyselastic_endpointandelastic_api_key. The values file reads both keys throughsecretKeyRef. - Run
helm installwith--valuespointing to Elastic’s file and--version 0.16.0.
On OpenShift, the page says to add a second values file after the first. I do not cover that case here: read the “Deploy on OpenShift” section of the documentation.
The final step on the Elastic side is to install the “Kubernetes OpenTelemetry Assets” and “System OpenTelemetry Assets” integrations in Kibana, then open the dashboards. That is the only check the page describes.
What the Operator deploys: daemon, cluster, gateway
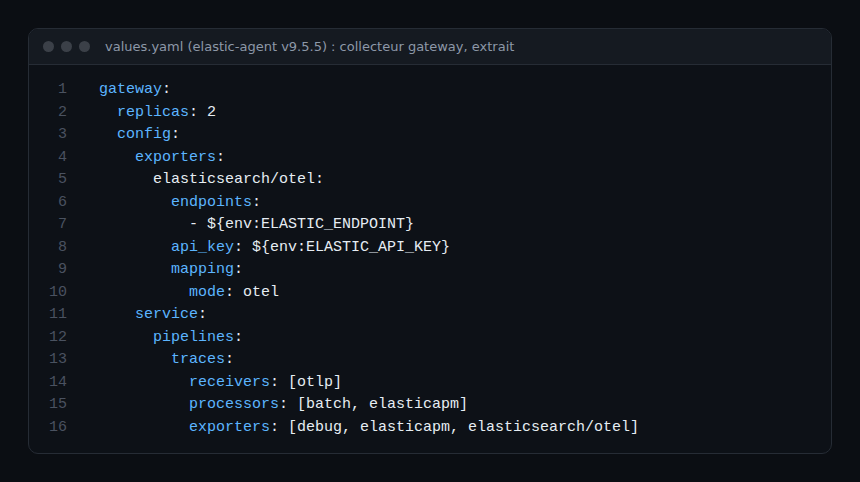
The values file (read from Elastic’s GitHub repository) enables the Operator CRDs, disables the Target Allocator and defines three collectors based on the docker.elastic.co/elastic-agent/elastic-agent image. The deployment modes documentation describes a two-tier design.
| Collector | Form | Role according to Elastic’s documentation |
|---|---|---|
| daemon | DaemonSet, one pod per node | Node logs and metrics, OTLP intake from applications, enrichment, forwarding to the gateway |
| cluster | Deployment | Cluster-level events and metrics, through the Kubernetes API |
| gateway | Deployment, 2 replicas in the file | Receives everything over OTLP, processes and exports to Elasticsearch |
The default configuration page lists the receivers: filelog, hostmetrics, kubeletstats and OTLP for the daemon, k8s_cluster and k8sobjects for the cluster collector. In the values file, the daemon enables log collection and hostNetwork, and runs as root to collect metrics. Review that constraint with your security team.
On the output side, the gateway uses the elasticsearch/otel exporter with the otel mapping mode. Traces also go through the elasticapm processor and connector.
To understand each component, our article on the Collector contrib components is the reference. If your target is Dynatrace rather than Elasticsearch, the agent-then-gateway structure still applies; see our guide to the Collector on Kubernetes.
Enable auto-instrumentation with an annotation
The file creates an Instrumentation resource named elastic-instrumentation. Its exporter points to the daemon collector service on port 4318 (OTLP HTTP). Propagators include tracecontext, baggage and b3, and the parentbased_traceidratio sampler is set to 1.0, meaning 100% of traces.
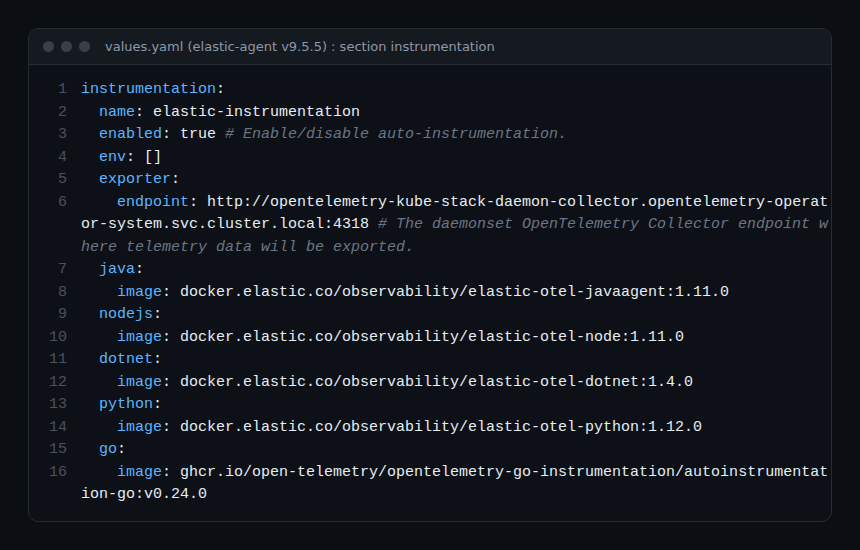
The referenced images are the EDOT agents for Java, Node.js, .NET and Python, and the OpenTelemetry auto-instrumentation agent for Go. To enable a namespace, Elastic’s documentation gives this command, where <LANGUAGE> is nodejs, java, python, dotnet or go:
kubectl annotate namespace MY_NAMESPACE \
  instrumentation.opentelemetry.io/inject-<LANGUAGE>="opentelemetry-operator-system/elastic-instrumentation"
You then need to restart the deployment. Elastic’s page gives no command; the OpenTelemetry documentation explains why: injection is evaluated when a pod starts, so existing pods must be recreated. A kubectl rollout restart deployment/my-app does it. The Instrumentation resource must exist before the pod, otherwise the opentelemetry-auto-instrumentation init container is not created.
The Go special case
According to the OpenTelemetry documentation, Go uses an eBPF sidecar behind the enable-go-instrumentation feature gate, and it runs privileged. Elastic’s file enables that flag in the manager arguments. Weigh this choice before enabling it in production.
How to check that it works
kubectl get pods -n opentelemetry-operator-system: the Operator, the daemon, the cluster collector and the gateway should be running. These are standard Kubernetes commands, not a step from Elastic’s page.- After restarting an annotated application,
kubectl describe podshould show the auto-instrumentation init container. If it is missing, check the annotation, the language and that the resource exists. - In Kibana, the integration dashboards should fill up.
For reliability, a quick check protects your MTTR: if traces are missing during an incident, you find out too late. For the general method, see observability versus monitoring.
Best practices
- Do not keep 100% sampling by reflex in production: the file sets 1.0 as a starting point. Our tail sampling guide helps you decide.
- Version your values and pin both the chart version and the file tag.
- Size the gateway: the file provides 2 replicas, a 1500m CPU limit and 1500Mi of memory. These are Elastic’s example values, not recommendations for your load.
- Enable cert-manager in production: the file recommends it in a comment, instead of the auto-generated certificate.
- Annotate by namespace, gradually, starting with a low-criticality service.
Frequently asked questions
What is EDOT Kubernetes?
It is the combination of Elastic’s EDOT Collector, deployed as daemon, cluster and gateway, and the EDOT auto-instrumentation agents, all installed by the OpenTelemetry Operator. Data flows over OTLP to Elasticsearch.
Does the Operator instrument all my applications?
No. It injects instrumentation only into annotated pods, for supported languages: Java, Node.js, .NET, Python and Go. For other languages, Elastic’s documentation points to manual EDOT SDK setup.
Can I send this data somewhere other than Elastic?
Elastic’s file configures the Elasticsearch exporter. Changing the destination means editing the gateway configuration; Elastic does not document that variant in the pages I read, so it is not verified here. See our article on choosing between APM Server and the EDOT Collector.
Conclusion
The Operator reduces EDOT Kubernetes deployment to one helm install and one annotation, but it does not replace your decisions: sampling, resources, security, data destination. Test on a pilot namespace, check the init containers and dashboards, then widen the rollout.
Sources
- Self-managed Kubernetes quickstart, Elastic documentation
- EDOT Collector deployment modes, Elastic documentation
- Default Kubernetes configuration, Elastic documentation
- Injecting auto-instrumentation, OpenTelemetry documentation
- kube-stack chart values.yaml, elastic/elastic-agent repository
span.observer is an independent blog, not affiliated with Dynatrace LLC or Elastic N.V. Elastic, Elasticsearch and Kibana are trademarks of their owners; the excerpts come from the official documentation and repository, and values in angle brackets are examples.