For a metric alert, the choice between a static threshold Dynatrace teams rely on and a baseline decides how much noise your on-call team gets. A fixed threshold is predictable, but it turns wrong when load changes. A baseline adapts, but it can also absorb a slow drift. This article explains how to choose, then how to configure anomaly detection on Dynatrace SaaS (Davis, now called Dynatrace Intelligence in the documentation). It does not apply to Dynatrace Managed, whose classic interface is covered in our Managed track, module 5.
The details come from the Dynatrace anomaly detection documentation, read on 31 October 2026. UI labels change quickly: check them in your own environment.
In brief
- A static threshold is a fixed limit: ideal for a value that must never be crossed (memory of a known process, disk space).
- An auto-adaptive threshold is recalculated daily from the previous seven days of measurements. A seasonal baseline builds a confidence band for seasonal data.
- In every case, a sliding window (3 minutes out of 5 by default) avoids alerting on a single sample.
- For services, applications and infrastructure, Davis automatic detection stays on: only its sensitivity is adjustable.
Static threshold Dynatrace or baseline: how to choose
The documentation gives a telling example. If a known process’s memory grows slowly over 30 days, a static threshold of 40 MB catches the abnormal behaviour. An adaptive threshold rises with the metric: it raises no problem, and the memory leak stays hidden.
Conversely, take a disk’s write time, a volatile metric whose load changes. A threshold set at 20 ms at the start would produce many false positives once the load rises. The adaptive threshold spares you from rewriting the configuration by hand.
| Situation | Choice | Why |
|---|---|---|
| Known limit (free disk, quota) | Static threshold | The limit must not move with the data. |
| Slow drift to catch (memory leak) | Static threshold | A baseline would follow the drift. |
| Variable load, unknown normal value | Auto-adaptive | The threshold adjusts without manual tuning. |
| Strong daily/weekly cycle | Seasonal baseline | A confidence band follows the pattern. |
How the baseline computes its threshold
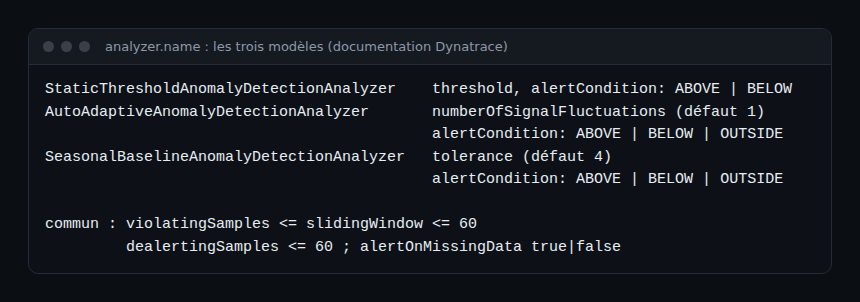
According to the page on auto-adaptive thresholds, the reference values are those of the last seven days. Dynatrace computes the 99th percentile of the per-minute measurements: that is the baseline. The interquartile range (between the 25th and 75th percentiles) serves as the signal fluctuation. The “number of signal fluctuations” parameter sets how many times that fluctuation is added to the baseline to give the alerting threshold.
When a configuration covers several entities, each gets its own threshold, evaluated independently: five hosts give five thresholds. The same page states a limit of 100 metric event configurations per environment.
Configure a custom alert step by step
The documented procedure (“Configure a simple custom alert”) works in the Anomaly Detection app or in Settings. The documentation says the app is deprecated and recommends Settings: Settings > Analyze and alert > Alerts > All alerts > Custom alerts.
- Choose New alert > Create your own custom alert, open the Simple tab, then expand Set scope.
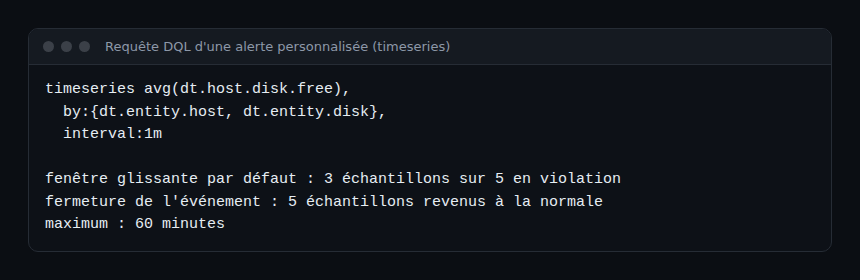
- In Query, enter the DQL query. The documentation recommends the
interval: 1mparameter for a resolution suited to the analysis. - In Define alert condition, pick the analyser (Select use case): static threshold, auto-adaptive or seasonal baseline.
- For a static threshold, enter the value and unit, or use Suggest values for a value computed from your recent data. Then choose Alert if metric is above or below.
- Select Preview to see what the alert would have triggered, fill in Title and Event name, then confirm with Create.
Then check the configuration’s Status shortly after creation: the documentation recommends it to spot execution errors.
Tune the sliding window and missing data
The sliding window (Advanced properties section) sets how many one-minute samples must violate the threshold. By default, 3 samples out of 5 raise an event and 5 normal samples close it; the maximum is 60 minutes. It is the first lever against noise, as our article on reducing Davis alert noise explains.
The Missing data alert option is combined with the threshold condition by a logical OR. The documentation advises against enabling it on sparse streams, where missing measurements are normal, because it can cause alert storms. For late data (five minutes for some cloud metrics), it advises a window of at least ten minutes.
Automate with the Settings API
DQL-based alerts use the builtin:davis.anomaly-detectors schema of the Settings 2.0 API. Authentication uses an OAuth client or a platform token, not a classic method. The listed permissions are settings:schemas:read and settings:objects:read, plus settings:objects:write to create, and the Grail permissions for the data queried. For automation, the documentation recommends a service user (iam:service-users:use).
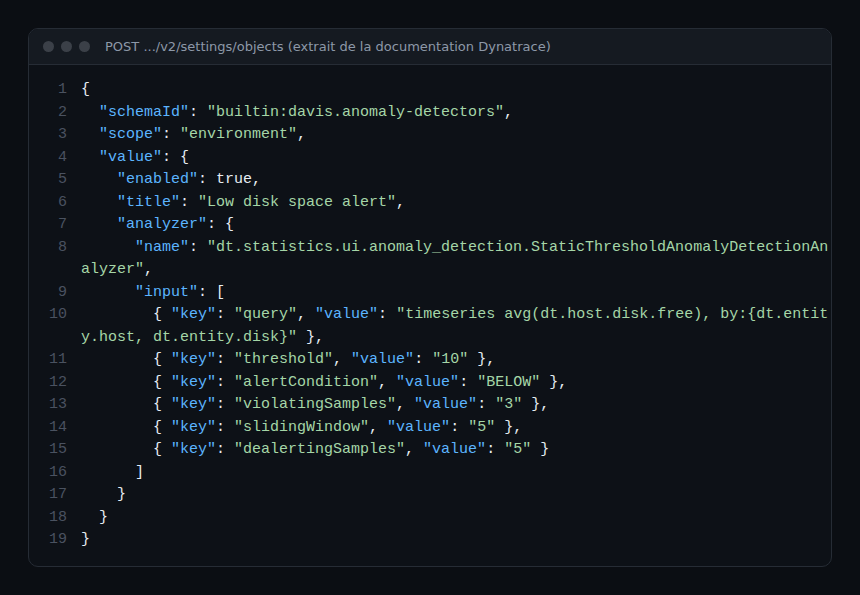
The query must return a time series (timeseries or makeTimeseries) with interval:1m, without from: or to:. The threshold is expressed in the base unit of the data (milliseconds for a duration), and slidingWindow must be greater than or equal to violatingSamples. To version these objects, see configuration as code with Monaco.
Sensitivity of automatic detection
For services, applications and infrastructure, Davis learns reference values on its own. The Adjust the sensitivity page contrasts low sensitivity (high statistical confidence, useful in pre-production) with high sensitivity (a problem is raised after just a few data points beyond the threshold, useful for critical services). You can also set absolute and relative thresholds, and a minimum number of actions per minute to ignore low-traffic applications. The global setting for services and infrastructure is under Settings > Analyze and alert > Alerts.
Best practices
- Use a static threshold for absolute bounds, a baseline for metrics whose load changes.
- Always run Preview before enabling, then watch the Status.
- Keep the default window (3 of 5) until noise justifies changing it.
- Limit the dimensions in
by:: each combination is evaluated separately. - Tie the alert to an SLO: a threshold without a reliability objective has no reference.
To create an alert end to end and route it, also read our alert creation tutorial.
Frequently asked questions
What is the difference between a static threshold and a baseline?
A static threshold never changes. A baseline recalculates its reference daily from the previous seven days of measurements.
Which sliding window should I choose?
The default is 3 violating samples out of 5. You can go up to 60 minutes to reduce noise, at the cost of slower detection.
Can these alerts be created through the API?
Yes, with the builtin:davis.anomaly-detectors schema of the Settings 2.0 API, an OAuth client or a platform token. Classic endpoints do not work.
Conclusion
A static threshold guards a known limit and reveals slow drifts. A baseline spares you from rewriting thresholds when load evolves. Combine them, check with Preview and keep a reasonable sliding window: the gain shows directly in MTTR and in on-call fatigue.
Sources
- Static thresholds for anomaly detection, Dynatrace documentation
- Anomaly detection configuration, Dynatrace documentation
- Automate alerts with API, Dynatrace documentation
span.observer is an independent blog, not affiliated with Dynatrace LLC. Product names belong to their respective owners; examples are taken from the official documentation or given for teaching purposes.