Your team runs the Elastic stack for logs and wonders whether to trust it with APM too, or to replace it: Elastic APM vs Dynatrace is the question that keeps coming up in architecture reviews. Both products collect traces, metrics and logs, but they rest on very different choices. This article lays out a grid of criteria you can verify yourself, with no verdict.
Every technical fact below comes from an official page (Elastic documentation or docs.dynatrace.com) read for the occasion. We quote no prices: they depend on the contract and are read on the official pages. This is the same approach as in our Dynatrace vs Datadog and Dynatrace vs New Relic comparisons. On the Dynatrace side we cover the SaaS platform; Managed is flagged where it matters.
Elastic APM vs Dynatrace: the differences that matter
Elastic describes its APM as a system “built on the Elastic Stack”: it measures response times for requests, database queries and external HTTP calls, and groups errors mainly by stack trace. Dynatrace relies on OneAgent, a single agent per host that discovers processes and enables instrumentation for the application stack. The table summarises the documented points.
| Criterion | Elastic APM | Dynatrace |
|---|---|---|
| Collection | Language agents, or the EDOT SDKs and Collector (Elastic’s OpenTelemetry distributions) | OneAgent (automatic instrumentation) or OTLP, chosen service by service |
| OpenTelemetry | Managed OTLP endpoint (Serverless and Elastic Cloud Hosted), data stored in OTel-native format; the APM Server OTLP intake translates to ECS and is not recommended for new users | Direct OTLP/HTTP API, or via a Collector (standard, Dynatrace or Bindplane); traces, metrics and logs |
| Query language | ES|QL, a piped language; Query DSL | DQL on Grail storage |
| Root cause analysis | Errors grouped by stack trace; other features to check in your edition | Causal AI root cause analysis on a causal topology; groups related anomalies into one problem |
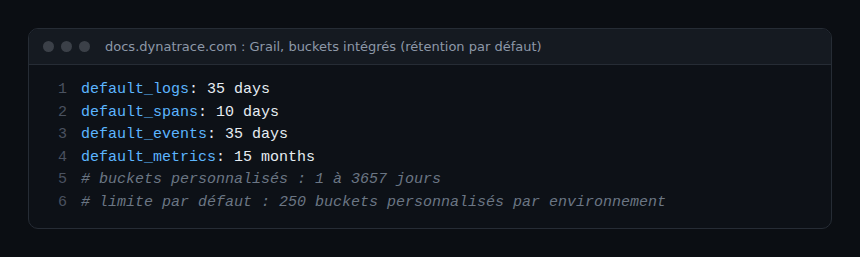
| Retention | ILM policies (hot, warm, cold, frozen, delete phases); data stream lifecycle in Serverless | Grail buckets: 35 days (logs), 10 days (spans), 15 months (metrics) by default; custom buckets from 1 to 3657 days |
| Hosting | Serverless, Cloud Hosted, ECK, ECE or self-managed | SaaS, or Managed on your own infrastructure |
| Billing model | Observability Serverless: GB ingested and data stored, counted separately | Dynatrace Platform Subscription: modular capabilities, with ingest, retention and query billed separately for logs, traces, events and metrics |
On retention, the Dynatrace durations above come from the Grail documentation; built-in buckets cannot be changed.
Instrumentation: proprietary agent or OpenTelemetry
For a platform team, the first question is the effort to get started. With OneAgent, the Dynatrace documentation states that a single instance per host discovers all processes and automatically instruments new components. It runs on the major clouds, Kubernetes, Docker and several operating systems including Linux and Windows.
On the Elastic side, the APM page now recommends Elastic OpenTelemetry for collecting application telemetry. EDOT includes a customised Collector and SDKs (.NET, Java, Node.js, PHP, Python, Android, iOS; Browser in technical preview). From version 9.5, the EDOT Collector capability is built into Elastic Agent. We cover this path in our article on Elastic Agent and the OpenTelemetry Collector and in the one on OTLP and APM Server.
One point cuts both ways. Elastic states that upstream contrib tools are community-supported: it cannot provide implementation support, and automatic installation of OpenTelemetry content does not happen. Dynatrace states that OpenTelemetry SDKs lack RUM-specific capabilities (user sessions, user actions, Core Web Vitals, Session Replay); for web and mobile it recommends RUM JavaScript and OneAgent for Mobile. In both cases OpenTelemetry remains a useful portable base, but the richest features go through the vendor’s own route.
Queries and data exploration
Both platforms offer a piped language. ES|QL is described as “a piped query language for filtering, transforming, and analyzing data” in Elasticsearch, with commands such as FROM, SORT and LIMIT. According to its documentation, DQL explores data stored in Grail (logs, metrics, traces, events) without a predefined schema. For the same question, compare readability and the time needed to write it.
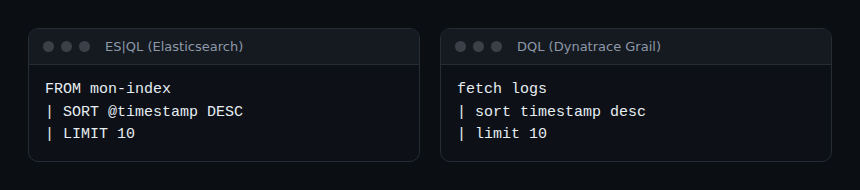
These two examples are ours, written with the commands named in the documentation; adapt the index name or source to your environment.
Retention and operations
This is often where teams feel the difference day to day. With Elasticsearch, retention is managed through ILM policies: you choose when an index moves from hot to warm, cold or frozen, and when the delete phase removes it. The documentation notes that ILM is not available in Elasticsearch Serverless, where data stream lifecycle takes over. That is great freedom, with the tuning work that comes with it; for the cost of cold tiers, see our article on the frozen tier.
With Dynatrace SaaS, retention is set per Grail bucket. Shortening a bucket’s period permanently deletes older data, and the deletion can take up to a few days. Built-in buckets have a fixed duration; you create a custom bucket to choose one.
On hosting, Elastic lists five options, from Serverless (run by Elastic) to self-managed, where you have “complete control and responsibility” for the deployment. Dynatrace Managed installs on your own infrastructure: you install and configure the cluster, with documented high availability and self-monitoring. If sovereignty requires self-hosting, both families allow it; the operating effort is yours to estimate.
Total cost of ownership: what the documentation says
We do not compare prices: the units differ, and any figure without your volume would be misleading. Estimate with your own volumes and ask for a dated written quote.
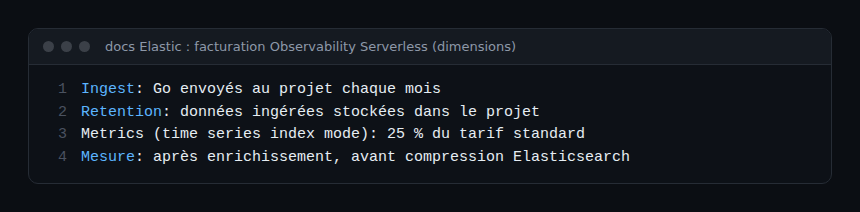
For Elastic Observability Serverless, ingest is billed on the GB sent each month, retention on the data stored, and time series metrics count at 25% of the standard rate. Volumes are measured after enrichment and before compression, so they can exceed the index size Elasticsearch reports. Dynatrace models its offer as capabilities; for logs, traces, events and metrics, ingest, retention and query are three separate lines.
How to run the comparison in practice
- Pick three representative services (a monolith, an API, an asynchronous job) and fix the grid before you start.
- Send the same OTLP data to both platforms with a Collector that duplicates the flows, as in the Collector deployment on Kubernetes.
- Time three injected failures (dependency latency, OOMKilled, a 500 error after a deployment) until the cause is found.
- Write the same query in ES|QL and in DQL and rate its readability.
- Count the operating hours: version upgrades, retention tuning, support.
- Project the bill over three years from written quotes.
How to check the comparison is fair
- Span volumes received are comparable on both sides over the same period; otherwise check sampling (see tail sampling).
- The retention tested is equivalent: a span bucket at 10 days is not comparable to an index kept for 30 days.
- The same on-call people test both tools without knowing the scenario.
Best practices
- Keep OpenTelemetry as your instrumentation base: the platform choice stays reversible. For context, read observability vs monitoring.
- Cite every criterion from the documentation and date your reading.
- Write a blameless report: what worked, what got stuck, with no loser named.
Frequently asked questions
Does Elastic APM accept OpenTelemetry natively?
According to the Elastic documentation, a managed OTLP endpoint exists on Serverless and Elastic Cloud Hosted, with OTel-native storage. The older APM Server OTLP intake translates data to ECS. Check the path that matches your deployment.
Does Dynatrace keep traces as long as Elasticsearch?
By default the built-in spans bucket keeps 10 days, according to the Grail documentation; a custom bucket can range from 1 to 3657 days. On the Elastic side, the duration depends on your ILM policy or lifecycle. Compare at equal duration.
Can you keep both tools?
Technically yes, with a Collector that duplicates the flows. It does double the operating effort, though; it suits a transition better than a target state.
Conclusion
Elastic APM and Dynatrace meet similar needs with different philosophies: a modular stack you tune, or a platform that automates more. The right choice depends on your context, volumes and hosting constraints, not on a ranking. A grid fixed in advance, the same OTLP data and written quotes make a decision you can defend.
span.observer is an independent community blog, not affiliated with Dynatrace LLC or Elastic N.V. Dynatrace and Elastic are trademarks of their respective owners. Features change: check them in the official documentation (Dynatrace, Elastic APM).