
DogStatsD unified service tagging ties your custom metrics to the traces and logs of the same service through three tags: env, service and version. Without them, a metric sent over UDP to port 8125 stays orphaned: you cannot filter it by deployment or compare it with the previous version.
This tutorial follows the Datadog documentation: send a metric to DogStatsD, set the tags on Kubernetes, then check that they arrive. For an SRE team the point is practical: during an incident, filtering on version:1.4.2 quickly tells you whether the regression follows the latest deployment.
This blog also covers custom metric cardinality and the APM billing model. Here we stay on tagging.
In short
- DogStatsD listens on UDP port 8125 (Agent v6 and later). The application waits for no reply.
- The reserved tags
env,serviceandversionare recommended by Datadog to link metrics, traces and logs. - If the service sees
DD_ENV,DD_SERVICEandDD_VERSION, the DogStatsD client adds these tags to custom metrics. According to the documentation, the .NET and PHP clients do not. - On Kubernetes, the Cluster Agent Admission Controller can inject these variables from pod labels.
DogStatsD unified service tagging: the problem to solve
A checkout.latency metric emitted by twenty pods is only useful if you know which environment and version it comes from. You could hard-code these tags in every call. That is fragile: a typo creates a new tag, hence a new series.
Unified tagging moves the decision out of the code. The deployment carries the values, the application reads them from its environment, and the client adds them. The goal here: get this behaviour on a Kubernetes service, then check it end to end.
Prerequisites, per the Datadog documentation: Agent 6.19.x or 7.19.x at minimum, a compatible SDK or client, and for automatic injection a Cluster Agent v7.40 or later. This article is about Datadog; it says nothing about Dynatrace Managed or SaaS.
Step 1: send a metric to DogStatsD on port 8125
Before tags, validate the network path. A datagram is: name, value, type, optional sample rate, then tags prefixed with #. The name accepts ASCII letters, digits, underscores and periods. Types are c (count), g (gauge), ms (timer), h (histogram), s (set) and d (distribution).
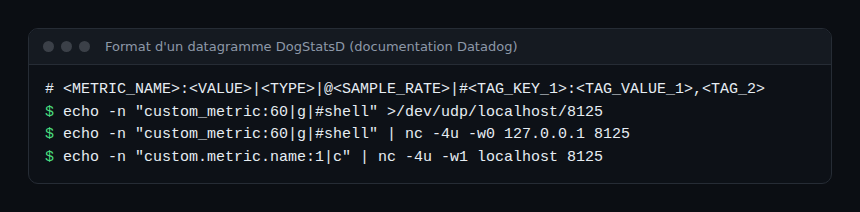
echo -n "custom_metric:60|g|#shell" >/dev/udp/localhost/8125
echo -n "custom_metric:60|g|#shell" | nc -4u -w0 127.0.0.1 8125
The -n option of echo removes the trailing newline. The -4u options of nc force IPv4 UDP. These commands come from the datagram format page of the documentation.
Where the Agent listens
On a host, set the port with dogstatsd_port in datadog.yaml, default 8125. In a container, publish 8125/udp and set DD_DOGSTATSD_NON_LOCAL_TRAFFIC="true" if metrics come from somewhere other than localhost. With Helm, the dogstatsd block accepts port, useHostPort and nonLocalTraffic.
On Kubernetes, the documentation suggests passing the node IP to the pod with DD_AGENT_HOST, read from status.hostIP. The pod then sends to port 8125 on that address.
Step 2: initialise the DogStatsD client
In the application, a DogStatsD client wraps the UDP sending. Python example from the documentation (pip install datadog):
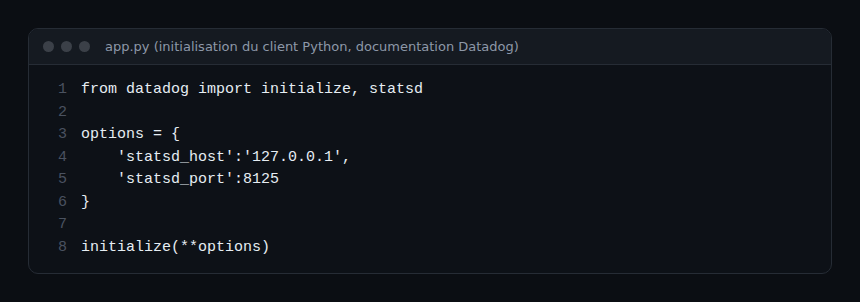
from datadog import initialize, statsd

options = {
    'statsd_host':'127.0.0.1',
    'statsd_port':8125
}

initialize(**options)
The Python client also offers statsd_constant_tags (tags applied to all metrics, events and service checks) and statsd_namespace (name prefix). The documentation notes that Python clients are thread-safe but not shared across processes: each child process creates its own client, or sets disable_buffering.
Constant tags remain useful for a tag that does not depend on the deployment. For env, service and version, prefer the unified mechanism below.
Step 3: set env, service and version on Kubernetes
The unified tagging documentation describes the full configuration: three labels tags.datadoghq.com/env, /service and /version, set on both the parent resource (Deployment) and the pod template. For APM you also add the variables DD_ENV, DD_SERVICE and DD_VERSION, read through the downward API (fieldRef) from those labels.
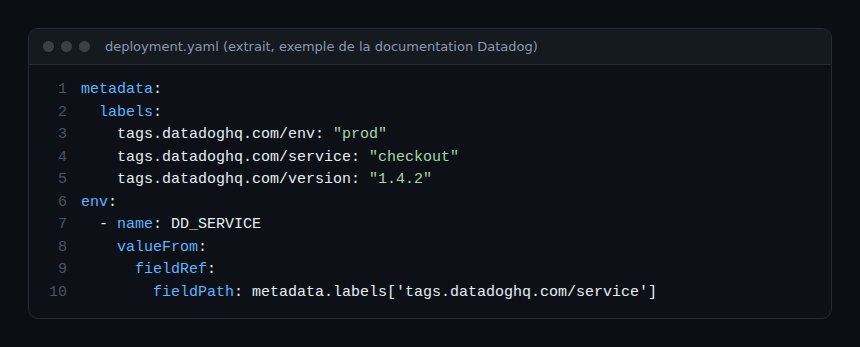
metadata:
  labels:
    tags.datadoghq.com/env: "prod"
    tags.datadoghq.com/service: "checkout"
    tags.datadoghq.com/version: "1.4.2"
env:
  - name: DD_SERVICE
    valueFrom:
      fieldRef:
        fieldPath: metadata.labels['tags.datadoghq.com/service']
For metrics and logs, the documentation says pod-level labels are enough: the DD_* variables are only required for APM. But for the DogStatsD client inside the application process to add the tags itself, the service must see the three variables. That is what the page says: if DD_ENV, DD_SERVICE and DD_VERSION are visible, the matching tags are added to custom metrics.
Multiple containers and Docker
For a multi-container pod, use tags.datadoghq.com/<CONTAINER_NAME>.env (and .service, .version). On Docker, the equivalent labels are com.datadoghq.tags.env, .service and .version.
Step 4: let the Admission Controller inject the variables
Writing the variables in every manifest is repetitive. The Cluster Agent Admission Controller does it for you. According to the Datadog documentation, it injects DD_AGENT_HOST, DD_TRACE_AGENT_URL, DD_ENTITY_ID and DD_EXTERNAL_ENV, plus env, service and version taken from labels. Pod labels win over labels on the owner resource, and an existing DD_ENV, DD_SERVICE or DD_VERSION variable is never overwritten.
Enabling options:
- Datadog Operator:
features.admissionController.enabledandfeatures.admissionController.mutateUnlabelled; - Helm:
clusterAgent.admissionController.enabledandclusterAgent.admissionController.mutateUnlabelled(enabled by default from chart version 2.35.0, per the page); - DaemonSet:
DD_ADMISSION_CONTROLLER_ENABLEDandDD_ADMISSION_CONTROLLER_MUTATE_UNLABELLEDvariables on the Cluster Agent.
Limits to know
- It is a
MutatingAdmissionWebhook: it only changes pods when they are created. A running pod receives nothing; recreate it. - It only covers APM and DogStatsD variables and the standard tags.
- With
mutateUnlabelled: false(the default), an unlabelled pod is not injected. A pod labelledadmission.datadoghq.com/enabled: "false"is never injected, even ifmutateUnlabelledistrue.
The communication mode (hostip by default, service, socket, csi) decides how DD_AGENT_HOST or the socket is filled in. The service mode needs Kubernetes 1.22 or later.
How to check that it works
- In the pod:
kubectl exec <pod> -- env | grep DD_should listDD_ENV,DD_SERVICEandDD_VERSIONwith your values. - In Datadog, open the Metrics Explorer and filter your custom metric: the
env,serviceandversiontags should appear as facets. - Deploy a new version: the
versionvalue must change. The documentation stresses this:versionshould change with each deployment.
I did not run these commands in a cluster for this article; they follow from the cited documentation. Review them in your own context.
- Do not give
envtwo different values: StatsD tags are append-only, so a metric can carry both. This also applies to a globalenv(Helmdatadog.tags) combined with a different pod label. - Avoid adding
versionto system metrics of a non-containerised host: it does not change per invocation. - Keep tag values low-cardinality;
versionis fine, a request ID is not. - UDP traffic has no acknowledgement: a lost metric raises no error in the application. Watch the Agent, not only the code.
What about OpenTelemetry?
According to the same page, DD_* variables are not supported out of the box with OpenTelemetry. You use OTEL_RESOURCE_ATTRIBUTES with service.name, service.version and deployment.environment.name, and OTEL_SERVICE_NAME overrides service.name. If you are weighing the two worlds, read our OpenTelemetry and Prometheus article and our Dynatrace and Datadog comparison. Dynatrace has its own tagging logic; I describe no undocumented equivalence here.
For deploying a collector in the same cluster, see the OpenTelemetry Collector on Kubernetes.
Frequently asked questions
Which port does DogStatsD use?
UDP 8125 by default for Agent v6 and later. Change it with dogstatsd_port in datadog.yaml or with DD_DOGSTATSD_PORT in a container.
Why do my DogStatsD metrics lack the version tag?
First check that the process sees DD_VERSION and that your client supports it: per the documentation, the .NET and PHP clients do not pick up these variables. Then check that the pod was created after the Admission Controller was enabled.
Do I need the DD_* variables for metrics?
For metrics and logs seen by the Agent, pod labels are enough. For the DogStatsD client to add the tags inside the process, the variables must be present.
Conclusion
Three labels, three variables and a well-set Admission Controller are enough for every custom metric to carry its environment, service and version. It is a small investment that speeds up diagnosis. To go further on method, read observability and monitoring.
Sources
- DogStatsD, Datadog documentation
- DogStatsD datagram format, Datadog documentation
- Unified Service Tagging, Datadog documentation
- Admission Controller, Datadog documentation
span.observer is an independent blog, not affiliated with Dynatrace LLC or Datadog Inc. Product names belong to their respective owners. Code excerpts reproduce examples from the official documentation; values are examples.