
Datadog custom metrics cardinality drives both your bill and how readable your dashboards stay. A custom metric is not a name: it is a unique combination of a name and tag values. Add a high-variability tag such as a request ID and the number of series explodes. This article shows how Metrics without Limits lets you cut that cardinality without touching code, based on Datadog’s official documentation.
For an SRE team the goal is twofold: keep the tags that alerts and SLOs rely on, and stop paying for tags nobody queries. The tutorial follows that order: understand the count, find the costly metrics, configure an allowlist or blocklist, then verify. It quotes no price; check Datadog’s official pricing page for that.
In short
- A custom metric is “a unique combination of a metric’s name and tag values (including the host tag)”, according to Datadog’s documentation.
- Metrics without Limits separates ingestion from indexing: you send everything, but only the tags you choose stay queryable.
- The Metrics Volume page flags metrics not queried in the past 30, 60 or 90 days.
- An excluded tag can no longer be queried in dashboards or monitors, so check usage before saving.
Datadog custom metrics cardinality: how the count works
Metrics sent through DogStatsD or a custom Agent check are custom metrics, as are those from some integrations. The “Custom Metrics” page gives an example: request.Latency has two tag keys, endpoint (X or Y) and status (200 or 400). That yields four combinations, so four custom metrics.
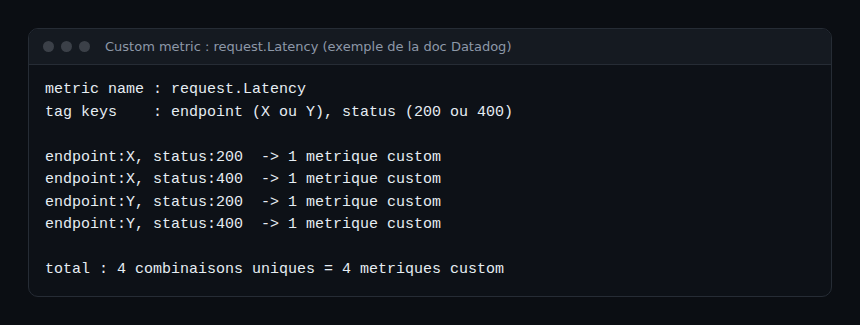
Multiplication is the trap. Two values per tag give four series; a tag with a thousand values multiplies the result by a thousand. The page also states that no fixed rate limit is enforced on submission: going over the default allotment falls under Datadog’s custom metrics billing policy. Some integrations have a default limit, for example 350 custom metrics for ActiveMQ XML, Go-Expvar and Java-JMX. Administrators (Admin role or the usage_read permission) can see the monthly average and the top 5,000 metrics on the Usage Details page.
The “Metrics Volume” page adds a distinction: a single metric name can emit several indexed custom metrics. Indexed volume is the real-time estimate; ingested volume comes from metrics already configured with Metrics without Limits.
Finding the metrics that cost the most
The volume management page (app.datadoghq.com/metric/volume) shows three rankings of up to 500 names: real-time estimated cardinality, change in volume (to catch an unexpected spike) and ingested volume of already configured metrics. You can filter by owning team.
Query Activity adds facets for metrics not queried in the past 30, 60 or 90 days. It checks dashboards, notebooks, monitors, SLOs, the Metrics Explorer and the API, and runs continuously in the background. For a specific spike, the Tags Cardinality Explorer helps pinpoint the responsible tag keys, which you can then exclude.
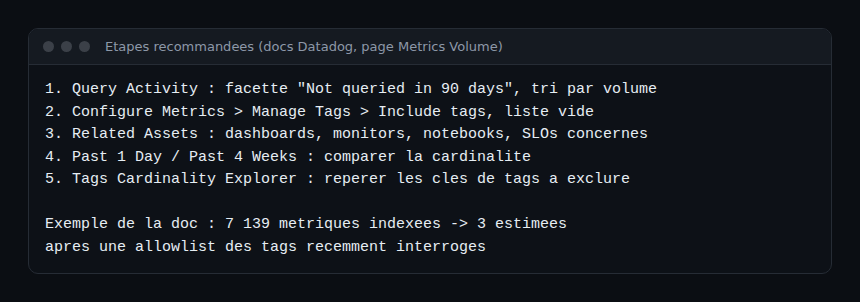
This list follows the order the documentation recommends. In its example, a metric with 7,139 indexed custom metrics drops to about 3 after an allowlist of recently queried tags. That is a vendor example, not a span.observer measurement: your gain will depend on your data.
Reducing cardinality step by step
Prerequisites: a metric with a declared type (the documentation says tags can only be managed when the type is set; Edit in Metrics Summary lets you set it) and, for the API, the Manage Tags for Metrics permission.
- Pick the target. In Query Activity, filter “Not queried in 90 days” and sort by volume. A never-queried metric is the best candidate.
- Check usage. Open the Related Assets panel to see which dashboards, monitors, notebooks and SLOs use it, and with which tags.
- Create an allowlist. In Metrics Summary, open the metric, click Manage Tags then Include tags. The dialog pre-fills tags queried in the last 30 days; add those your assets use without an active query.
- Read the estimate. Check “Estimated New Volume” before saving. If the estimate shows more indexed than ingested metrics, the documentation says not to save.
- Option: blocklist. With Exclude Tags, excluded tags are no longer queryable. Through the API,
exclude_tags_mode: truecreates or edits a blocklist.

To act on a whole namespace, use Configure Metrics then Manage Tags. “Allow all tags” overrides earlier configurations; Include or Exclude can override or keep them. The include_actively_queried_tags_window attribute limits included tags to a time window, which is 30, 60 or 90 days in the interface. The API call to create a configuration is POST /api/v2/metrics/{metric_name}/tags; I did not verify the request body details on that page, so read it before writing a script.
How to check that it works
Go back to the Metrics Volume page after the change. The metric’s indexed volume should fall while the ingested volume stays visible. Then compare using Past 1 Day or Past 4 Weeks, and create a Change monitor on percentage change if you want to be warned of a new spike.
Finally, review your alerts: a monitor that grouped by an excluded tag would stop returning data. This step protects your MTTR, because a silent alert costs more than one extra series.
Link with OpenTelemetry and Dynatrace
With OpenTelemetry, cardinality is also handled before export: limiting metric attributes in the SDK or the Collector avoids producing the series at all. Our article on the Datadog OpenTelemetry Collector (DDOT) shows one entry path, and the piece on Datadog APM billing covers the other cost area. To place the approaches in context, read the difference between observability and monitoring and the Dynatrace and Datadog comparison. I claim no undocumented integration between the two products.
Best practices
- Keep unbounded identifiers (user, request, ephemeral container) out of metric tags.
- Run a quarterly Query Activity review with the owning teams.
- Keep the tags used by critical SLOs and monitors in the allowlist.
- Alert on cardinality change with a Change monitor.
Frequently asked questions
What is a custom metric in Datadog?
It is a unique combination of a metric name and tag values, host included. Metrics from DogStatsD or a custom Agent check count as custom metrics.
What is the difference between ingested and indexed metrics?
Ingested metrics are the original volume with every tag sent. Indexed metrics are those that remain queryable after configuration.
Can I lose data by excluding a tag?
You keep sending the data, but an excluded tag is no longer queryable in dashboards and monitors. Check Related Assets before saving.
Conclusion
Reducing Datadog custom metrics cardinality means measuring first, then keeping queryable only the tags that earn their place. Metrics without Limits does this without code changes, provided you check usage before saving. Always confirm commercial terms on the official page.
This article is published on an independent blog, not affiliated with Dynatrace LLC or Datadog Inc. The information comes from Datadog’s official documentation, consulted on 30 October 2026; no price is quoted. Sources: Metrics without Limits, Metrics Volume, Custom Metrics, Metrics API.