Datadog APM billing rests on two separate meters: APM hosts, measured at the 99th percentile, and spans, both ingested and indexed. For an SRE or platform team, the bill therefore depends not only on how many servers you run, but also on what your traces produce and on what you choose to keep.
This guide follows the method described in Datadog’s official documentation, read on 30 October 2026, and suggests a way to control it. None of the figures here are span.observer measurements, and no price is quoted: prices change, so check Datadog’s official APM billing page for current values.
Datadog APM billing: the two meters
According to the “APM Billing” page of the Datadog documentation, a host counts as an APM host when APM is installed on it and it sends traces. Datadog counts these hosts every hour. At month end, billing uses the 99th percentile: the page explains that the top 1% of values are ignored, to protect you from an unexpected spike.
The second meter covers spans. The documentation separates:
- Ingested Spans, billed on the total gigabytes ingested during the month;
- Indexed Spans, meaning spans kept by retention filters, billed on the number of spans indexed.
Each APM host includes a monthly allowance of ingested and indexed spans. The page gives one million indexed spans and 150 GB of ingested spans per host per month. Only usage above these allowances is billed at the span rate.
How Datadog computes usage at the 99th percentile
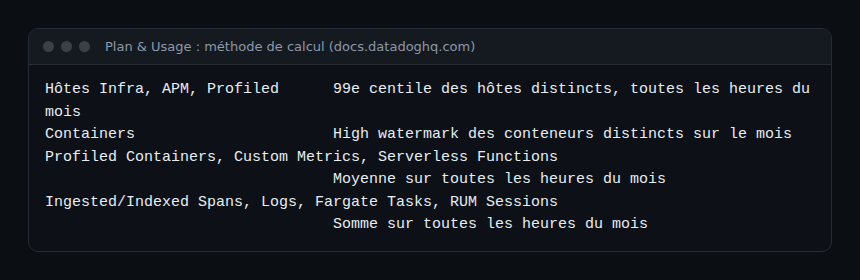
The “Usage Details” page describes the method behind the month-to-date table. For infrastructure, APM and profiled hosts, it is the 99th percentile of distinct hosts over all hours in the month. Containers follow another rule, the high watermark. Ingested and indexed spans are a sum over all hours in the month.
The APM Billing page explains how to read the 99th percentile: it is the ninth-highest hourly measurement of the month, or the eighth-highest in February. In practice, a spike lasting a few hours does not raise your host bill. A high level sustained for more than 1% of the month does.
What this changes in containers
Two details in the documentation matter a lot on Kubernetes platforms. First, billing is per node, not per pod, and pause containers are excluded. Second, the page recommends one Agent per underlying host: with one Agent per container, each container is billed as a host. That is a classic deployment trap, worth checking before you roll out widely.
AWS Fargate and Lambda
For Fargate, Datadog records concurrently monitored tasks every five minutes, then bills the monthly average. For Lambda, the documentation ties the indexed-span allowance to the number of invocations. One caution: the page shows an allowance of 195,000 indexed spans for Fargate in its table, while its deployment example implies a different value. Confirm the figure on the page before building any budget.
Ingested spans versus indexed spans
Ingestion is the flow of spans sent to Datadog. Indexing is the retention, after ingestion, of some spans for search and analysis. The retention page is explicit: retention filters do not control ingestion; ingestion controls do.
This has a practical consequence. Reducing indexed spans lowers the “Indexed Spans” line, but not the ingested volume. To act on the latter, sample earlier, in the library, the Agent or an OpenTelemetry Collector. Tail sampling with OpenTelemetry illustrates this logic on the Collector side, and our article on Datadog trace metrics explains why RED metrics stay accurate despite sampling.
The intelligent retention filter
According to the “Trace Retention” page, an intelligent filter is always on. It combines diversity sampling with 1% flat sampling. The documentation states that the spans it indexes do not count towards indexed span usage and do not affect your bill. Spans kept by custom or default filters, however, are the ones that are billed.
Durations differ: spans kept by retention filters are stored for 15 days, those from the intelligent filter for 30 days, per the same page.
Cutting the cost: a five-step approach
- Count the hosts. In Plan & Usage, open the APM tab and compare billed hosts with those actually sending traces.
- Check Agent deployment. One Agent per node, not per container.
- Measure ingestion by cause. The usage metric carries the
ingestion_reasontag, which shows which configuration generates the volume. - Review retention filters. Keep errors and traces useful for diagnosis; narrow very broad queries.
- Monitor continuously. Put the usage metrics in a dashboard and a monitor.
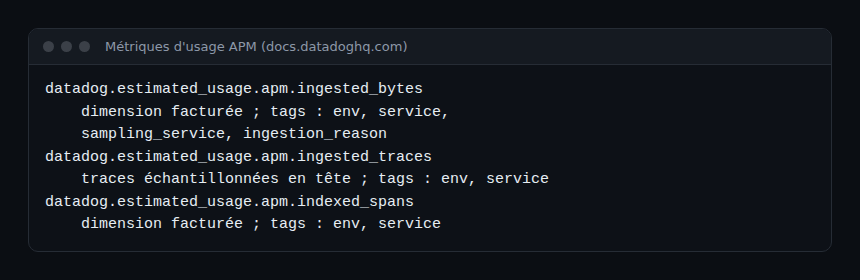
The “Usage Metrics” page lists the usage metrics. The two billed dimensions are datadog.estimated_usage.apm.ingested_bytes (tags env, service, sampling_service, ingestion_reason) and datadog.estimated_usage.apm.indexed_spans (tags env and service). The page offers no monitor threshold: set one from your own history. It also mentions two ready-made dashboards, “APM Traces Estimated Usage” and “APM Ingestion Reasons”.
Creating a retention filter
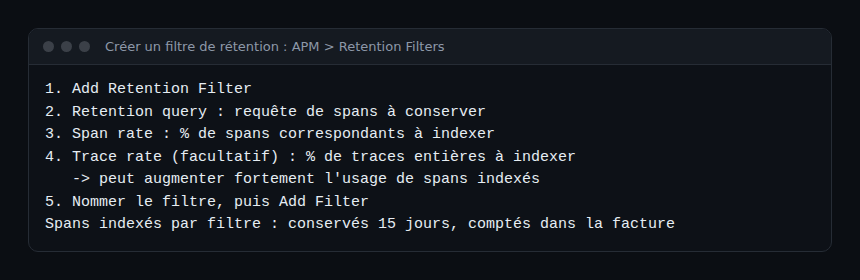
According to the documentation, the procedure is: in APM, open Retention Filters, click Add Retention Filter, define the span query and the span rate to index, optionally a trace rate, name the filter, then save. The page warns that the trace rate can significantly increase indexed span usage. Start with the span rate.
Link with OpenTelemetry and Dynatrace
Cost control is largely decided before Datadog. If you instrument with OpenTelemetry, sampling in the Collector sets the volume that reaches any backend. Our article on Datadog’s OpenTelemetry Collector (DDOT) shows one entry path.
To compare cost models, remember that Dynatrace bills on a different principle, covered in the article on DPS licensing, and that the Dynatrace and Datadog comparison puts these choices in an SRE context. Always compare identical scopes, using prices read on official pages.
Best practices
- Reread the 99th percentile method before interpreting a spike: it may cost nothing.
- Treat ingestion and indexing as two separate budgets with two owners.
- Always keep a filter for errors; without it, incidents lose their traces.
- Date your budget calculations: the documentation evolves.
Frequently asked questions
What is the 99th percentile for APM hosts?
Datadog counts hosts every hour, then at month end ignores the top 1% of values. A brief spike is therefore not billed.
What is the difference between ingested and indexed spans?
Ingested spans are billed on the gigabytes received. Indexed spans are those kept by retention filters, billed by count.
Are intelligent retention filter spans billed?
According to the Datadog documentation, no: they do not count towards indexed span usage. Spans from custom and default filters do.
Conclusion
To control Datadog APM billing, separate three levers: the number of hosts at the 99th percentile, the ingested volume and the number of indexed spans. Measure them with the usage metrics, then adjust sampling and filters without losing error traces. Finally, check every price on the official page.
This article is published on an independent blog, not affiliated with Dynatrace LLC or Datadog Inc. The information comes from Datadog’s official documentation read on 30 October 2026; no price is quoted. Sources: APM Billing, Usage Details, Trace Retention.