An ingestion script sends one metric every ten seconds, and the metrics pool balance melts away with nobody sure why. The Dynatrace DDU (Davis data unit) is the unit of that count in classic licensing. Knowing how to calculate it by hand lets a team forecast consumption before deployment instead of discovering it at the end of the quarter.
This guide details the calculation for metrics: the weight of a data point, the effect of dimensions, the metrics included per host unit, and how to read consumption through the API. It applies to Dynatrace Managed and to Dynatrace SaaS under classic licensing; the documentation pages consulted describe the same calculation on both sides.
One piece of context: the documentation states that this model is legacy and that all new contracts are signed on DPS. These pages therefore cannot be used to estimate a DPS price. For that case, see Dynatrace DPS licensing and consumption.
Dynatrace DDU: what consumes and what does not
According to the documentation, DDUs are sold in lots of one million on a one-to-three-year term, and the quota renews every contract year. The capabilities measured in DDUs are custom metrics, log monitoring, custom events and third-party traces. Host monitoring is not measured with DDUs.
For metrics, the documentation separates three cases:
- Free: default OneAgent metrics, such as host metrics.
- Included first, DDUs after: extension metrics bound to a host or process, and API metrics bound to a monitored host (not a process).
- Always DDUs: Python, calculated service, log and DEM metrics, plus AWS, Azure and Google Cloud metrics not bound to a OneAgent host.
Cloud Foundry, Kubernetes Cluster and VMware metrics do not consume DDUs. The rest depends on your contract: when in doubt, the documentation points to Dynatrace.
Calculating the weight of a metric
The base is simple: each ingested data point deducts 0.001 DDU from the quota. A metric sent once a minute therefore costs 525.6 DDUs a year (1 × 60 × 24 × 365 × 0.001). Every ten seconds, the same signal costs 3,153.6 DDUs a year. The documentation recommends one-minute ingestion.
Dimensions multiply the points. Each unique combination of metric key and dimension values is a separate data point. Two hosts reporting the same metric consume 0.002 DDU per minute; four host and CPU combinations, 0.004. A descriptive dimension determined by the others changes nothing: the documentation example adds host_ip next to hostname with no effect.
For SRE teams, the consequence is clear. A high-cardinality dimension (request or user identifier) inflates the bill far faster than a higher frequency. Cost is therefore managed when the metric is written, not afterwards.
Metrics included per host unit
A host in Full-Stack Monitoring includes 1,000 metrics per host unit, evaluated every minute. Only the excess consumes DDUs. In Infrastructure mode, the allowance is 200 metrics per host, with a minimum of 200. These included metrics only cover metrics bound to OneAgent hosts or processes; calculated service, DEM and log metrics are not eligible.
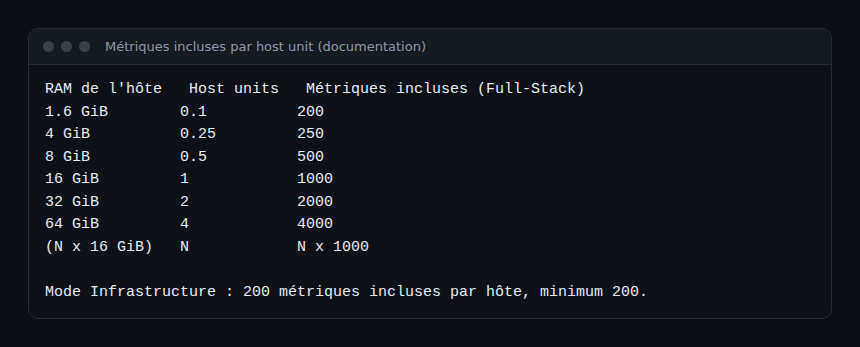
The point to remember: the allowance follows host size. A small 4 GiB host only includes 250 metrics. And if the metrics pool is exhausted, the documentation states that the included metrics are no longer available either.
A worked example, step by step
Take a 16 GiB Full-Stack host: 1 host unit, 1,000 included metrics. It reports 1,500 metrics bound to OneAgent, plus 300 API metrics unrelated to it.
- Host-bound excess: 1,500 − 1,000 = 500 paid metrics.
- Unrelated metrics: 300, all paid.
- Total: 800 points per minute, or 0.8 DDU per minute (the documentation’s result).
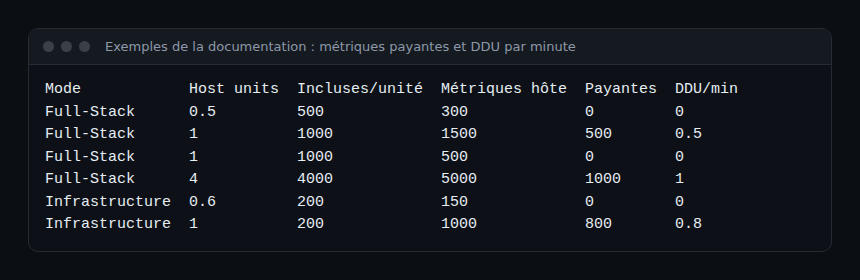
Extrapolating, which is span.observer’s own arithmetic and not a vendor figure: 0.5 DDU per minute for a year comes to 262,800 DDUs. That is more than the 200,000 free DDUs the documentation lists for new SaaS environments and Managed licences (excluding Offline and pay-as-you-go accounts). One slightly chatty host is enough to exceed the free allowance.
Reading consumption through the API
Consumption is available in the Environment API v2 under builtin:billing.ddu. Three keys are worth knowing:
builtin:billing.ddu.includedMetricDduPerHost: DDUs included per host (1,000 included metrics equal 1).builtin:billing.ddu.metrics.byEntityRaw: DDUs reported per entity, before the included allowance.builtin:billing.ddu.metrics.byEntity: DDUs consumed, hence billable, per entity.
The nuance matters: “reported” DDUs are totals before allowances, “consumed” DDUs are those deducted from the balance. The per-entity breakdown, which accounts for allowances, is the billing basis; the per-metric breakdown is informational only. On Managed, the request goes through GET /e/{environment-id}/api/v2/metrics/query, with a token carrying the metrics.read scope.
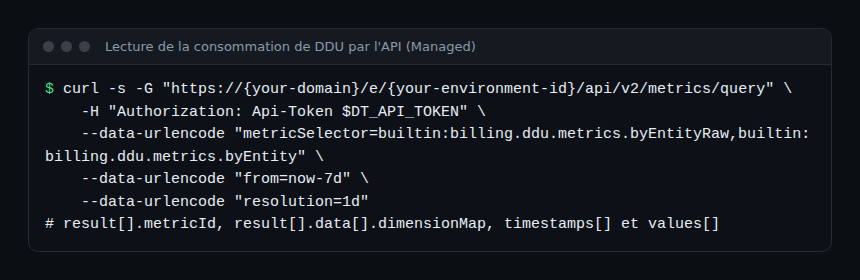
The response holds a result array; each element carries a metricId and data series with dimensionMap, timestamps and values as parallel arrays. dimensions is deprecated in favour of dimensionMap.
How to check the calculation is right
- Pick a test host and note its size, its mode (Full-Stack or Infrastructure) and the number of metrics it reports.
- Calculate the excess and the DDU per minute with the method above.
- Query
byEntityRawandbyEntityfor that host: the gap should match the included metrics. - Wait ten minutes: per the documentation, per-entity data can lag by up to ten minutes.
- Compare with the Account Management screen, License/Subscription, Overview, Davis data units page. Access needs the “Manage monitoring settings” permission or an administrator account.
A short-lived host may appear as “Undefined” if its name was not stored. The documentation offers dedicated keys for this case, for example builtin:billing.full_stack_monitoring.usage_per_host.
Good practice
- Ingest every minute unless a real need says otherwise. Going from 10 seconds to 1 minute divides consumption by six.
- Limit dimension cardinality before enabling a new metric, as in creating a custom metric.
- Set monthly or yearly limits per environment. The documentation says they are not enforced by default and that a notification fires at 90% and 100%.
- Build a chart in Data Explorer with the three keys above and watch the slope, not only the total.
- If a cluster is shared between teams, tie the tracking to per-environment quotas.
Frequently asked questions
Is a DDU the same thing as a host unit?
No. The host unit measures the monitoring of a host, by memory. The DDU measures custom metrics, logs, events and third-party traces. The two meet through included metrics: each Full-Stack host unit entitles you to 1,000 metrics.
Do DDUs still exist with DPS licensing?
The documentation describes DDUs as a classic model and says new contracts are signed on DPS. DPS pricing relies on a rate card specific to the contract: do not estimate it with this article’s formulas.
Why does the displayed consumption differ from one screen to another?
Reported DDUs come before the included-metrics deduction, consumed DDUs after it, and per-entity data can lag by up to ten minutes. Always compare quantities of the same kind.
Conclusion
The DDU calculation comes down to three rules: 0.001 DDU per point, one point per dimension combination and per interval, then deduction of the host’s included metrics. With these rules, a team forecasts consumption before deploying and quickly spots the dimension that costs. To go further, read the Managed metrics course.
span.observer is an independent community blog, not affiliated with Dynatrace LLC. Dynatrace is a trademark of its owner. Licensing rules vary by contract: check them in the official documentation and with Dynatrace.