
An XHR request is an HTTP request sent from the browser by the JavaScript object XMLHttpRequest. It lets a page exchange data with a server without reloading. According to MDN, the API is used to send HTTP requests between a web page and a server, and despite its name it is not limited to XML.
In this article you will write an XHR request step by step, handle the response and the errors, understand CORS blocks, and then see how Real User Monitoring (RUM) measures these requests for real users. The Dynatrace part applies to Dynatrace SaaS and Dynatrace Managed alike: the notion of an XHR action is the same in the classic RUM of both platforms.
In short
- XHR is the historical AJAX API: you create the object, attach listeners, call
open, thensend. - Fetch is recommended today where possible, but XHR remains common in existing code bases and in many libraries.
- Errors come mostly from three sources: the HTTP status, the network and CORS. Each one is diagnosed differently.
- Real User Monitoring measures the duration and the failures of these requests in the browser, on real journeys, which lab tests cannot show.
What an XHR request is, concretely
When you click “Load more” and new items appear without a change of URL, an XHR request (or its Fetch equivalent) has most likely been sent in the background. The principle, described by MDN in its guide on fetching data from the server, separates two tasks: JavaScript asks the server for data, then manipulates the DOM to update the interface, instead of triggering a full navigation.
The acronym AJAX (Asynchronous JavaScript and XML) dates from a time when XML was the usual exchange format. Today the server most often returns JSON, sometimes HTML or text, as the same MDN page recalls. A course from the University of Caen Normandy (in French) stresses two points: the response is not necessarily XML, and the listener must be added before launching the request with send.
The word “asynchronous” is central. The browser does not wait for the response to keep rendering the page and reacting to clicks. You describe what must happen when the response arrives, and the code moves on.
Writing an XHR request step by step
According to MDN, a request follows three steps: create the object, open the URL with open, then send with send. The async argument of open is true by default or when omitted: the request is then asynchronous. Here is a minimal example that retrieves JSON.
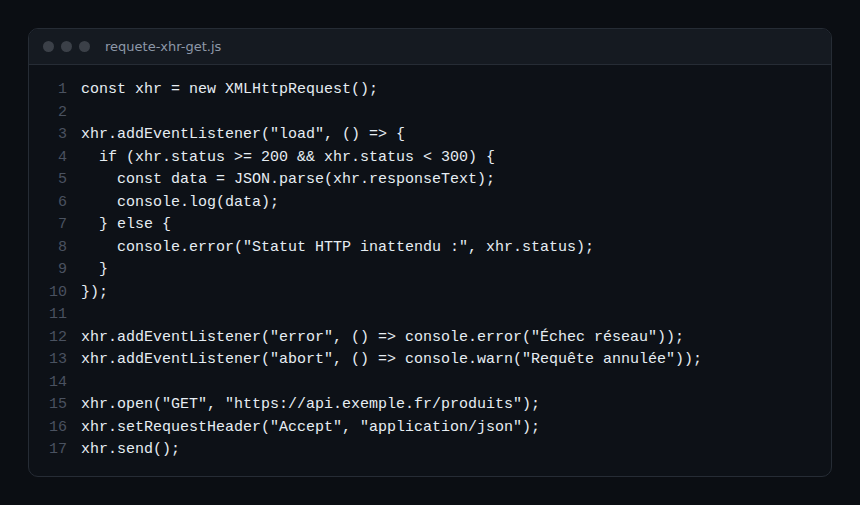
const xhr = new XMLHttpRequest();

xhr.addEventListener("load", () => {
  if (xhr.status >= 200 && xhr.status < 300) {
    const data = JSON.parse(xhr.responseText);
    console.log(data);
  } else {
    console.error("Unexpected HTTP status:", xhr.status);
  }
});

xhr.addEventListener("error", () => console.error("Network failure"));
xhr.addEventListener("abort", () => console.warn("Request aborted"));

xhr.open("GET", "https://api.example.com/products");
xhr.setRequestHeader("Accept", "application/json");
xhr.send();
The four steps to remember
- Instantiate the object with
new XMLHttpRequest(). - Attach the event listeners. MDN states they must be added before calling
open, otherwiseprogressevents are not captured. - Open the request with
open(method, url). Headers are set afteropenand beforesend. - Send with
send(). According to the XMLHttpRequest.send() page, this method sends the request to the server and accepts an optional parameter for the body, used mainly for requests such as PUT. For GET or HEAD, that body is ignored.
Sending data with POST
For a JSON POST, open the request with the POST method, declare the content type, then pass the body to send. The example below also adds a timeout, detailed further on:
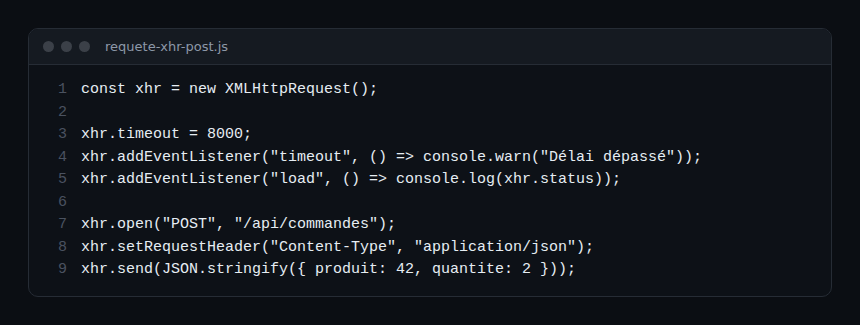
const xhr = new XMLHttpRequest();

xhr.timeout = 8000;
xhr.addEventListener("timeout", () => console.warn("Timed out"));
xhr.addEventListener("load", () => console.log(xhr.status));

xhr.open("POST", "/api/orders");
xhr.setRequestHeader("Content-Type", "application/json");
xhr.send(JSON.stringify({ product: 42, quantity: 2 }));
Choosing the response type
The responseType property states the expected format: text (the default), arraybuffer, blob, document or json. For a JSON API, setting xhr.responseType = "json" before sending avoids the manual JSON.parse: the result is then read from xhr.response, which is null if the server returns anything other than valid JSON. To download a file, blob is the usual choice.
Following the flow: events, status and errors
An XHR request goes through several states, and the readyState property gives the current one. The historical MDN example tests readyState === XMLHttpRequest.DONE (the value 4) and status === 200 before reading the response. Modern events are more readable than the old onreadystatechange.
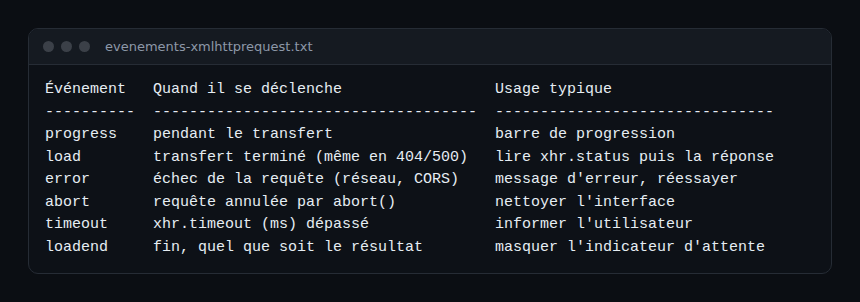
| Event | When it fires | Typical use |
|---|---|---|
progress |
During the transfer | Progress bar for a download |
load |
Transfer complete | Read the response and the status |
error |
Request failed (network, CORS) | Error message, retry |
abort |
Request cancelled | Clean up the interface |
timeout |
xhr.timeout exceeded |
Inform the user |
loadend |
End, whatever the outcome | Hide a loading indicator |
This table follows the definitions in the MDN documentation. One trap: load also fires for a 404 or 500 response, because the transfer did complete. So always test xhr.status in the load handler, as in the example above. The error event, on the other hand, signals that the request could not complete at all.
Handling the timeout
By default, xhr.timeout is 0, meaning no timeout: a request can stay pending for a long time. Set xhr.timeout in milliseconds and listen for the timeout event to inform the user, rather than leaving an indicator spinning forever. That value is also a good starting point for deciding what counts as “too slow” in your monitoring.
Why an XHR request fails: HTTP, network and CORS
Three families of problems come back again and again. Telling them apart saves a lot of time.
HTTP errors (4xx and 5xx)
The server answered, but with a failure status. The request “succeeded” as a transfer, the load event fires, and it is up to your code to read xhr.status. A 401 or 403 points to authentication, a 404 to a wrong URL, a 500 to a server-side problem.
Network errors
No usable response: connection dropped, DNS not found, invalid certificate. Only the error event fires, with no useful status. In the browser, the detail stays deliberately vague, and the Network tab of the developer tools is your best ally.
CORS errors
The browser enforces the same-origin policy. A request to another domain only succeeds if the server allows it. MDN states that XMLHttpRequest works as long as the server is configured to accept your web application’s origin, through the Access-Control-Allow-Origin response header. In code, the symptom looks like a network error, but the browser console gives a precise CORS reason.
Two frequent cases:
- Cookies are not sent. By default, credentials (cookies, authentication headers) are not sent in a cross-origin request. The client must set
xhr.withCredentialstotrue, and the server must answer with the Access-Control-Allow-Credentials: true header, otherwise the browser reports a network error. - You are testing from a local file. CORS requests can only use the HTTP or HTTPS schemes. According to MDN, a page opened as
file:///has an opaque origin and causes a CORS error in Firefox as in Chrome. Run a small local server instead.
Fixing a CORS block is almost always done on the server, by configuring the response headers. No client-side JavaScript can cleanly bypass this rule.
XHR or Fetch: which to choose today?
For new code, MDN advises Fetch where possible, because the API is simpler and offers more features. XHR remains common in historical code bases: it is the API that preceded Fetch and the first to enable AJAX (MDN source).
In practice, you will meet XHR in three situations:
- an old application to maintain, where rewriting every call is not a priority;
- a third-party library that uses XHR internally;
- a need to track file upload progress, where the XHR
progressevent remains handy.
For monitoring, the good news is that the choice does not change the essentials: Dynatrace RUM captures XMLHttpRequest calls as well as fetch() calls, and you can migrate gradually without losing visibility on your calls.
Accessibility: do not forget what changes on the page
An asynchronous content update is invisible to someone using a voice browser if nothing announces it. The WAI-ARIA standard provides specifications to limit this kind of problem, as the Wikipedia page on XMLHttpRequest recalls. Concretely, flag important changes with an aria-live region and manage focus after a partial load.
Monitoring XHR requests with Real User Monitoring
Your code works on your machine, with a good connection. But your users have mobile networks, browser extensions, old devices. Real User Monitoring collects measurements directly in their browser to answer a simple question: what do users actually experience?
RUM and field data
Google uses field RUM data to determine whether a site meets the recommended Core Web Vitals thresholds, as web.dev explains. The same article notes that the RUM data you collect yourself complements CrUX-based tools, with more detailed and more immediate feedback.
What Dynatrace does with XHR requests
In Dynatrace, a user interaction that triggers XMLHttpRequest or fetch() calls creates an XHR action. The “User actions” page of the Dynatrace documentation states that the action starts with the user’s click, that Dynatrace also detects additional XHRs triggered in the callback of the first one, and that it waits until all requests are finished before ending the action. A web user action lasts at most 3 minutes. For a single-page application, where almost all communication goes through XHR after the first load, this is what makes journeys measurable.
Two settings worth knowing in the web application configuration (classic RUM, SaaS and Managed): XHR capture is enabled under Capturing > Async web requests and SPAs > Generic support, option “Capture XmlHttpRequest (XHR)”, and exclusion rules based on a regular expression on the URL leave out technical calls (heartbeat, telemetry) that would create spurious actions. Another documented point: the request must start within 30 ms of the interaction; promise-based code can exceed that window, and Dynatrace then recommends the RUM JavaScript API to create the action yourself.
What you can read next depends on your configuration, but the questions to ask are always the same:
- Which action is the slowest for users, and on which browser or device type?
- Which XHR call causes the errors, with which HTTP code?
- Does the slowness come from the network or the server? Compare the browser-side duration with the server-side trace.
- Do JavaScript errors appear right after an unexpected response?
For setting up the JavaScript injection, choosing applications and reading Core Web Vitals, follow our guide on configuring RUM in Dynatrace. Once your actions are measured, our module on the metric selector and alerts shows how to query these metrics and raise an alert when a duration exceeds your threshold.
An example of a diagnostic approach
Imagine a search page that users complain is “sluggish”. Here is a realistic approach, with no invented figures:
- In RUM, filter on the XHR action triggered by the search and look at the distribution of durations rather than the average.
- Segment by browser, country and connection type, to see whether the problem is general or localised.
- If the duration is long everywhere, open the associated distributed trace and look for the service or database query responsible.
- If it is only long on mobile, examine the response size: an API returning too many fields is expensive on a slow network.
- After the fix, compare before and after over the same period to confirm the effect.
For latency objectives based on the distribution rather than the average, see also our OpenPipeline histogram metrics. And to reproduce a slow call from a coding agent, Chrome DevTools MCP gives access to the Network panel from the assistant.
Best practices for reliable XHR requests
- Always test
statusinload, never just the arrival of the event. - Set a
timeoutand a clear message for the user. - Cancel requests that have become useless with
abort(), for instance when the user types a new search. - Avoid synchronous mode: it blocks the interface, and
timeoutas well asresponseTypeare forbidden there in a page. - Prefer HTTPS and never put a secret in client code.
- Measure in production: a call that looks fast in development can be slow for your users.
Our view
At span.observer, we find that most questions about XHR requests hide a monitoring question: the request goes out, but nobody knows how long it takes for the user or why it fails.
We believe a developer progresses faster by connecting three levels: the code (this guide), the browser-side measurement (RUM) and the server-side trace. That is why our Dynatrace tutorials start from concrete production problems, on Managed as on SaaS, and remain free, independent and advertisement-free.
Our approach is to give you immediately applicable moves: configure, read, query, alert. You learn at your own pace, and you can share these resources with your team.
Going further with our free resources
If you want to move from the isolated XHR request to a complete view of your applications, our free observability training follows a progressive path, from signals to SLOs. It is aimed at developers, SREs and IT managers who want to train their teams.
Frequently asked questions
What is an XHR request?
It is an HTTP request sent by the JavaScript object XMLHttpRequest from the browser. It retrieves or sends data to a server without reloading the page. The exchanged format is most often JSON, even though XML appears in the name.
XHR and Fetch, what is the difference?
Both send HTTP requests from the browser. MDN advises Fetch where possible, because it is simpler and richer in features. XHR remains useful for maintaining existing code, and Dynatrace RUM captures both mechanisms alike.
Why is my XHR request blocked by CORS?
The destination server does not allow your page’s origin. Its CORS response headers must be configured, and withCredentials added on the client if cookies must be sent. Also check that you are not testing from a page opened as file:///.
What does Real User Monitoring measure on an XHR request?
It measures, in real users’ browsers, the duration and outcome of the calls triggered by their actions. In Dynatrace, these calls form XHR actions that you can filter by browser, location or application. Our RUM guide details the configuration.
Sources
- Using XMLHttpRequest, MDN
- XMLHttpRequest.send(), MDN
- Making network requests with JavaScript, MDN
- Ajax: Asynchronous JavaScript & XML, University of Caen Normandy (French)
- Access-Control-Allow-Credentials header, MDN
- Reason: CORS request not HTTP, MDN
- Getting started with measuring Web Vitals, web.dev
- User actions (XHR actions), Dynatrace documentation
- Configure Real User Monitoring to capture XHR actions, Dynatrace documentation
- XMLHttpRequest, Wikipedia
span.observer is an independent community blog, not affiliated with Dynatrace LLC. Product names belong to their respective owners; the code examples and URLs are fictitious and given for teaching purposes.