This free observability training brings together, in one path, the courses published on span.observer: concepts, signals, metrics, SLOs, then hands-on practice on a platform. It is aimed at operations engineers, SREs, developers and administrators who want to move from threshold-based monitoring to observability that explains incidents.
You do not need to follow everything. The page gives a recommended order, what each course brings, and how to choose between the Dynatrace Managed branch (a cluster hosted on your side, classic interface, metric selector) and the Dynatrace SaaS branch (Grail platform, DQL, Notebooks). Every module is free, with no sign-up.
Each module follows the same shape: a short lesson, a hands-on exercise you can run in a test environment, an answered quiz and links to the official documentation.
The free observability training plan
| Step | Content | Format | For whom |
|---|---|---|---|
| 1. Concepts | Observability vs monitoring | Reference article | Everyone |
| 2. Metrics | Managed metrics course or SaaS metrics course | 7 modules each | Operations, SRE |
| 3. Reliability | SLO SLA training | 6 modules | SREs, service owners |
| 4. Platform | Dynatrace Managed course or Dynatrace SaaS course | 8 modules each | Administrators, platform teams |
The order goes from general to specific: understand what you measure, learn to read metrics, set reliability objectives, then master the tool. If you already run a platform, start with step 4 and come back to steps 2 and 3 afterwards.
Step 1 — Concepts: signals and questions
Monitoring answers questions planned in advance (“is CPU above 90%?”). Observability lets you answer questions you had not thought of, from the signals the system emits. The observability vs monitoring article sets out these definitions and the common mistakes.
Three telemetry types come back in every course, and must never be confused:
- Traces: the path of a request through services. A trace is made of spans, one per operation.
- Metrics: numeric measurements aggregated over time (throughput, errors, duration, saturation).
- Logs: timestamped events, textual or structured.
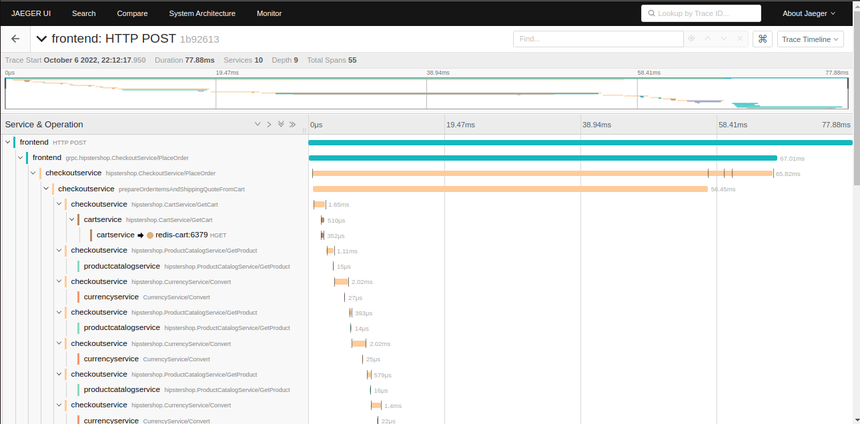
The screenshot above, from the OpenTelemetry demo, shows a trace: each bar is a span, and the waterfall immediately reveals which call takes the time. This is the kind of reading the courses teach, in open source tools as well as in Dynatrace.
Step 2 — Metrics: keys, dimensions, queries
Both metrics courses follow the same 7-module plan: understanding keys and dimensions, then host, service, application, process and container, and cloud metrics, and finally queries and alerting. They differ in language:
- Managed:
builtin:metrics, metric selector and Metrics API v2; - SaaS:
dt.*metrics stored in Grail, queried with the DQLtimeseriescommand.
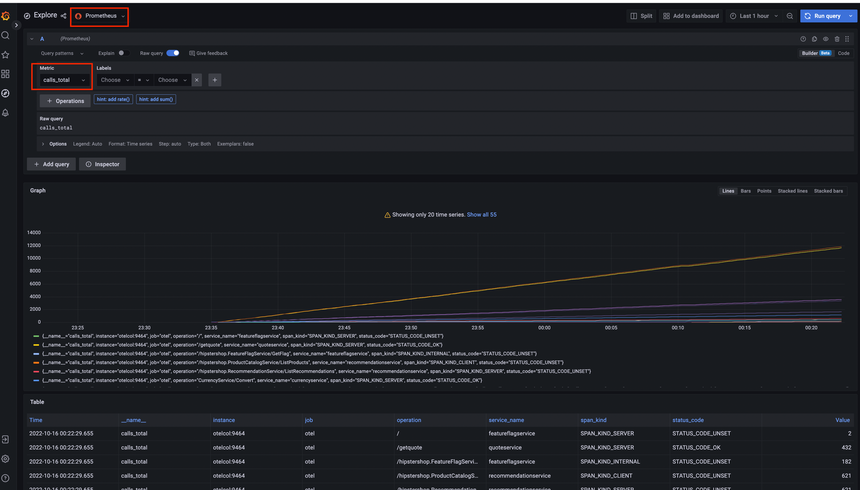
This screenshot, also from the OpenTelemetry demo, illustrates the notion of dimension: a single metric, calls_total, splits by service, operation, span kind and status code. Choosing the right dimension avoids unreadable dashboards and useless alerts.
Step 3 — Reliability: SLI, SLO, SLA
The SLO SLA training turns metrics into commitments. Its 6 modules cover definitions and common mistakes, error budget and burn rate calculation, creating an SLO in Dynatrace SaaS and then in Dynatrace Managed, the error budget policy (deployment freeze, alerts) and writing an SLA from SLOs.
This step changes an on-call team’s daily life: you alert on error budget consumption, not on every CPU spike. Fewer, more relevant alerts, and an MTTR you can measure.
Step 4 — The platform: Managed or SaaS
Dynatrace Managed course (8 modules)
Concepts, architecture and installation of a test cluster, deploying OneAgent and ActiveGate, exploring data and PurePaths, alerting and alerting profiles, tags and management zones, running the cluster (health, backups, updates) and API automation. Choose it if your organisation runs a Managed cluster.
Dynatrace SaaS course (8 modules)
The Grail platform and its apps, deploying OneAgent and Dynatrace Operator on Kubernetes, DQL fundamentals, Notebooks and Dashboards, problem analysis, logs with OpenPipeline, Workflows and finally OpenTelemetry and AI. Choose it for a SaaS environment or a free trial.
The two courses do not mix: menus, APIs and query languages differ. If you are migrating from one to the other, follow the one for your current environment first.
How to follow the training effectively
- Prepare a test environment: a SaaS trial, or a Managed staging environment. Exercises must never touch production.
- One module per session: lesson, exercise, quiz. Write down your wrong quiz answers: they are your review points.
- Apply it to a real service: after metrics and SLOs, write the SLO of a service you know.
- Complete with official sources: the OpenTelemetry documentation for signals, the Dynatrace documentation for the platform, and Dynatrace University for official certifications.
How to check what you have learned
- You can explain the difference between a trace, a span, a metric and a log, with an example from your own system.
- You can write a query that counts a service’s errors per minute (metric selector on Managed, DQL on SaaS).
- You can compute the error budget of a 99.9% SLO over 30 days: 0.1% of 43,200 minutes, i.e. 43.2 minutes.
- You can say which alert would wake up the on-call engineer, and why.
Frequently asked questions
Is this observability training really free?
Yes. Every course and module is openly available, with no sign-up. Only the test environment may have a cost, depending on the vendor’s offer.
Do I need to know Dynatrace to start?
No. Steps 1 to 3 apply to any observability platform; the screenshots on this page actually come from open source tools. Only step 4 is specific to Dynatrace.
Does this training lead to a certification?
No. span.observer is an independent blog: the courses prepare you for practice, not for an exam. Official certifications are handled by Dynatrace University.
Conclusion
Useful observability training follows the order of real work: understand the signals, read the metrics, set reliability objectives, then master the platform. The four steps on this page connect the existing courses into one coherent path; start with the step that matches your current need.
span.observer is an independent community blog, not affiliated with Dynatrace LLC. This course does not replace the official training and certifications of Dynatrace University. Check features in the official documentation for your version.