
Module 7 of the Dynatrace Managed metrics course, on the Dynatrace metric selector, alerts and the Metrics API v2: write a metric query, call it with curl, create the metrics you are missing, then raise a Davis alert when they drift.
Learning path: Dynatrace Managed metrics training · Module 7/7 · Duration: ~75 min · Level: Intermediate to advanced
Objectives:
- Read a metric descriptor and chain metric selector transformations
- Write an arithmetic expression between metrics and call
/api/v2/metrics/querywith curl - Create a calculated service metric, a log metric or an ingested metric
- Configure a metric event: static, auto-adaptive or seasonal baseline threshold
Prerequisites: modules 2 to 6; an API token with the metrics.read scope, then WriteConfig, metrics.ingest and settings.write depending on the step; curl, jq and a test environment.
The previous modules showed which metrics to look at. This one shows how to query them, then how to turn them into an on-call signal. The Dynatrace metric selector is the language shared by Data Explorer, dashboard tiles, metric events and the Metrics API v2: the same string draws a chart, feeds an SLO and raises an alert.
This module applies to Dynatrace Managed (and to classic metrics in SaaS). It does not cover DQL or Grail’s timeseries command, which are specific to Dynatrace SaaS and covered in the SaaS metrics course.
The Dynatrace metric selector: one syntax everywhere
A selector starts with one or more metric keys, followed by transformations separated by colons and evaluated from left to right. Each transformation applies to the result of the previous one.
builtin:host.cpu.usage:sort(value(avg,descending)):limit(10)Two limits to know: a selector contains at least one key, and a query reads at most 10 metrics. For several metrics with the same parent, the documentation allows the short form builtin:host.cpu.(usage,idle).
The Dynatrace documentation’s advice: build your selectors in the Code tab of Data Explorer (advanced mode), which offers auto-completion, then copy them into the API or a configuration.
Start with the descriptor
Before writing a selector, read the metric’s descriptor with GET /api/v2/metrics/{metricId}. Three fields matter: aggregationTypes (the possible aggregations), defaultAggregation (the one applied if you do not specify any) and dimensionDefinitions (the dimension keys you can use in splitBy and filter).
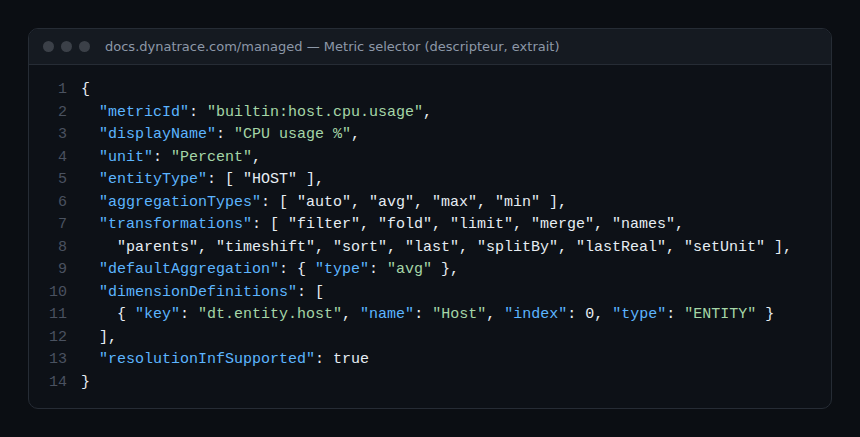
Here, builtin:host.cpu.usage aggregates as an average by default and has a single dimension, dt.entity.host.
The essential transformations
| Transformation | Syntax | Effect |
|---|---|---|
| Aggregation | :max, :avg, :percentile(90)… |
Time aggregation, per time slot |
| Split by | :splitBy("dim1","dim2") |
Keeps these dimensions, merges the others; :splitBy() merges everything |
| Filter | :filter(eq("dim","value")) |
Filters on a dimension or on a series value |
| Fold | :fold(max) |
Reduces each series to a single data point |
| Sort / Limit | :sort(value(avg,descending)):limit(10) |
Top N |
| Default | :default(0) |
Replaces null values |
| Rate | :rate(1m) |
Turns a count into a rate |
| Rollup | :rollup(avg,15m) |
Smooths over a sliding window |
| Time shift | :timeshift(-1d) |
Shifts the timeframe (comparison with yesterday) |
| To unit | :toUnit(<source>,<target>) |
Converts the data points’ unit (unit list: GET /api/v2/units) |
Aggregating over time and space
Without an explicit aggregation, the metric uses its default aggregation. To see the CPU peak of each time slot rather than the average:
builtin:host.cpu.usage:maxTo get a single figure, the peak of the whole timeframe, add fold:
builtin:host.cpu.usage:fold(max)Space aggregation goes through splitBy. Without an argument, it merges all hosts into one series:
builtin:host.cpu.usage:splitBy()Filtering by dimension, entity or value
The eq condition compares a dimension with a value; in accepts an entity selector, which lets you filter by tag. Inner quotes are escaped with a tilde:
builtin:host.cpu.usage
  :filter(
    in(
      "dt.entity.host",entitySelector("type(~"HOST~"),tag(~"easyTravel~")")
    )
  )
The series condition filters on the aggregated value of each series: here, only hosts whose average exceeds 80% remain.
builtin:host.cpu.usage:filter(series(avg,gt(80)))Conditions combine with and, or and not.
Rate, rollup and timeshift need an aggregation
The documentation requires an aggregation before rate, rollup and toUnit. Example of 15-minute smoothing, useful for a trend chart:
builtin:host.cpu.usage:avg:rollup(avg,15m)And the same metric shifted by one day, to overlay on today’s curve:
builtin:host.cpu.usage:timeshift(-1d)Arithmetic expressions between metrics
The selector accepts + - * / between metrics and numbers, with brackets. Series are paired by dimension tuple, then aligned by timestamp. The documentation’s example computes a service error rate:
builtin:service.errors.total.count:value:default(0)
/
(
    builtin:service.errors.total.successCount:value:default(0)
    +
    builtin:service.errors.total.count:value:default(0)
)
default(0) stops a time slot without errors from nulling the whole ratio. Two rules from the documentation: apply limit to the result of the expression, never to the operands, and do not use an expression to convert a unit (use toUnit).
Calling the Metrics API v2 with curl
In Managed, the endpoint is https://{your-domain}/e/{your-environment-id}/api/v2/metrics/query (or through an ActiveGate, default port 9999). It requires the metrics.read scope.
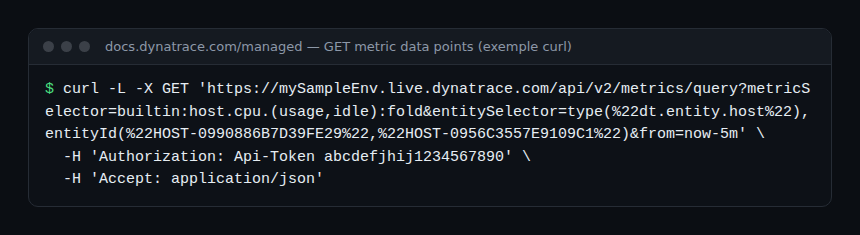
Adapted to a Managed cluster, with curl encoding the parameters:
export DT_ENV="https://dynatrace.example.com/e/your-environment-id"
curl -sS -G "$DT_ENV/api/v2/metrics/query" \
  -H "Authorization: Api-Token $DT_TOKEN" \
  --data-urlencode 'metricSelector=builtin:host.cpu.usage:sort(value(avg,descending)):limit(5)' \
  --data-urlencode 'from=now-24h' \
  --data-urlencode 'resolution=1h' \
  | jq '.result[0].data[] | {host: .dimensionMap["dt.entity.host"], last: .values[-1]}'
Parameters to know:
resolution: 120 data points by default; a timespan (10m,1h) orInffor a single point. The finest resolution is one minute, and it also depends on the age of the data.from/to: timestamp, ISO date or relative (now-2h, the default forfrom).entitySelector: restricts to the chosen entities, for exampletype("HOST"),tag("prod").mzSelector: restricts to a management zone, for examplemzName("Payment").Accept: text/csv; header=presentheader: CSV response instead of JSON.
The full list of Managed endpoints is in Dynatrace Managed API: endpoints and schemas, and broader automation in module 8 of the Managed course.
Creating the metrics you are missing
Built-in metrics cover most needs, but not all: the response time of a single payment endpoint, the number of refused orders read from a log, the depth of an internal queue. Three mechanisms fill these gaps: calculated service metrics (calc:service.), log metrics (log.) and metric ingestion.
These are custom metrics: unlike built-in metrics, they consume Davis data units (DDUs). Create them for a precise need, not by reflex.
Creating a calculated service metric
A calculated service metric applies conditions to a service’s requests (tag, URL path, request attribute…) and measures a value: REQUEST_COUNT, RESPONSE_TIME, FAILURE_RATE, ERROR_COUNT, CPU_TIME, and so on. It can be split by a dimension, limited to the top N values.
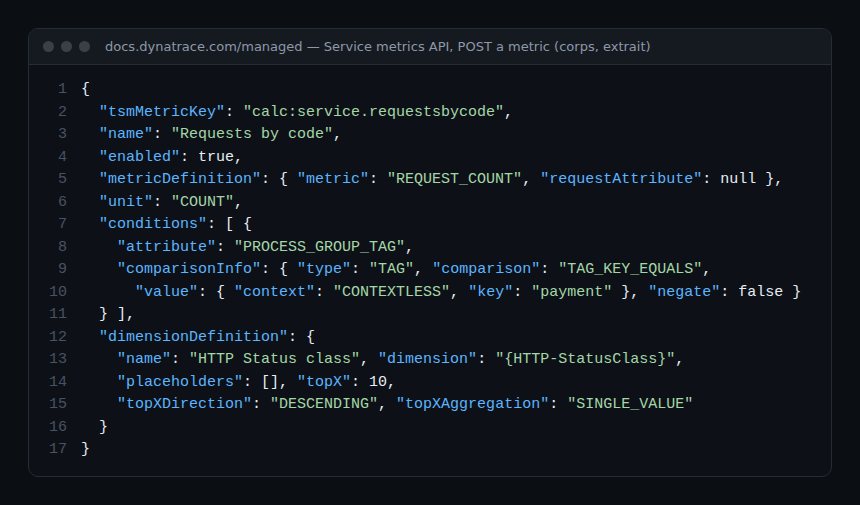
The configuration API creates it with POST /api/config/v1/calculatedMetrics/service (WriteConfig scope). The documentation’s example counts the requests of services tagged payment, per HTTP status class:
curl -sS -X POST "$DT_ENV/api/config/v1/calculatedMetrics/service" \
  -H "Authorization: Api-Token $DT_TOKEN" \
  -H "Content-Type: application/json; charset=utf-8" \
  -d @requestsbycode.json
# expected response (201): {"id":"calc:service.requestsbycode","name":"Requests by code"}
Points to watch:
tsmMetricKeymust start withcalc:service.; it is the key you then use in the metric selector.dimensionDefinitionwithtopXcaps the number of dimension values kept: a split by full URL would blow up cardinality.- The metric has no history: it starts filling up when it is created.
Once created, it is queried like any other: calc:service.requestsbycode:splitBy("dt.entity.service"):sum for example, adapted to the dimensions of its descriptor.
Extracting a log metric
In Log Monitoring Classic, a log metric is created in Settings > Log Monitoring > Metrics extraction, with Add log metric, or from the log viewer with Create metric. Its key always starts with log.. You choose:
- a Matcher: the log query that selects the lines;
- a measure: Occurrence of log records (number of lines) or Attribute value (numeric value of an attribute);
- optional dimensions, taken from log attributes.
A typical example: log.payment.refused, counting lines containing a payment provider’s refusal code, split by provider. Two limits: the metric only exists for logs ingested after its creation, and the documentation sets a ceiling of 1,000,000 dimension values per metric. Choose low-cardinality dimensions. Editing the key creates a new metric: history stays under the old one.
Ingesting your own metrics
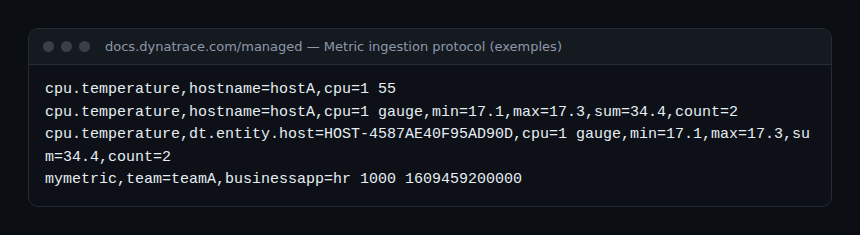
For a measurement no agent sees (queue size, batch result, business figure), send data points to POST /api/v2/metrics/ingest (metrics.ingest scope), in the text format of the ingestion protocol. One line = one data point:
curl -sS -X POST "$DT_ENV/api/v2/metrics/ingest" \
  -H "Authorization: Api-Token $DT_TOKEN" \
  -H "Content-Type: text/plain; charset=utf-8" \
  --data-binary 'batchjob.duration,job=facturation,dt.entity.host=HOST-4587AE40F95AD90D gauge,412'
# expected response (202): "linesOk": 1, "linesInvalid": 0
Protocol rules to remember:
- Gauge by default; the
count,delta=…format creates a metric suffixed.count. - 50 dimensions at most;
dt.entity.host(and the otherdt.entity.*) binds the data point to an entity, and therefore the alerts to that entity. - Timestamp in UTC milliseconds, accepted from one hour in the past to ten minutes in the future.
dt.prefix forbidden, reserved for Dynatrace; payload limited to 1 MB per request.- From a monitored host, OneAgent also exposes a local endpoint (
http://localhost:14499/metrics/ingestby default) that needs no token.
Alerting on a metric with metric events
A metric event turns any metric, built-in or custom, into a Davis event, and therefore into a problem and a notification. It is configured in Settings > Anomaly detection > Metric events, or through the Settings API with the builtin:anomaly-detection.metric-events schema.
- Query type:
METRIC_KEY(one key, static threshold only) orMETRIC_SELECTOR(a full selector, expressions included). - Model:
STATIC_THRESHOLD,AUTO_ADAPTIVE_THRESHOLDorSEASONAL_BASELINE; the last two require a metric selector. - Sliding window:
samplesone-minute samples, of whichviolatingSamplesmust violate the threshold to open the event, anddealertingSamplesmust return to normal to close it. - Missing data:
alertOnNoData; the documentation advises turning it off for sparse series.
Example: alert when the failure rate of a service tagged payment exceeds 5% for 3 minutes out of 5. The body follows the schema’s fields; check them on your version with GET /api/v2/settings/schemas/builtin:anomaly-detection.metric-events.
[{
  "schemaId": "builtin:anomaly-detection.metric-events",
  "scope": "environment",
  "value": {
    "enabled": true,
    "summary": "Payment failure rate > 5%",
    "queryDefinition": {
      "type": "METRIC_SELECTOR",
      "metricSelector": "builtin:service.errors.total.rate:filter(in(\"dt.entity.service\",entitySelector(\"type(~\"SERVICE~\"),tag(~\"payment~\")\"))):splitBy(\"dt.entity.service\"):avg"
    },
    "modelProperties": {
      "type": "STATIC_THRESHOLD",
      "threshold": 5,
      "alertCondition": "ABOVE",
      "alertOnNoData": false,
      "samples": 5,
      "violatingSamples": 3,
      "dealertingSamples": 5
    },
    "eventTemplate": {
      "title": "High payment failure rate",
      "description": "The failure rate exceeds 5%.",
      "eventType": "ERROR",
      "davisMerge": true
    }
  }
}]
Send it with POST /api/v2/settings/objects (settings.write scope). Routing the resulting notifications is the job of alerting profiles: see Alerting, profiles and integrations in Managed and, to avoid an avalanche, Reducing Davis alert noise.
Hands-on exercise
Step 1 — Read a descriptor
curl -sS "$DT_ENV/api/v2/metrics/builtin:host.disk.avail" \
  -H "Authorization: Api-Token $DT_TOKEN" | jq '.dimensionDefinitions[].key'
Expected result: dt.entity.host and dt.entity.disk.
Step 2 — Build a top 5 in Data Explorer
In the Code tab, write a selector that shows the five hosts with the highest average CPU over 24 hours, then add a second query with :timeshift(-1d). Expected result: two overlaid curves over the same timeframe.
Step 3 — Ingest a metric and find it
Send five batchjob.duration data points one minute apart with the ingestion command above, then type batchjob.duration:splitBy("job"):max in Data Explorer. Expected result: "linesOk": 1 for each call, then a facturation series with your five values.
Step 4 — A test metric event
Create a static threshold metric event on this metric, with a threshold below your values. Expected result: a problem opened on the host referenced by dt.entity.host.
Step 5 — How to check that it works
The /api/v2/metrics/query response must contain "totalCount" and a result array; a 403 code means a missing scope, a 400 a syntax error described in the message. Then open the problem: the event carries the title of your eventTemplate. In Settings > Anomaly detection > Metric events, the overview also flags failing configurations (QUERY_FAILED, THROTTLED) over the last 24 hours. Finally, delete the test event.
Best practices
- Prototype in Data Explorer, then copy the selector into the script, dashboard or metric event.
- Filter early and always
sortbeforelimit: fewer series read, a meaningful top N. - One custom metric per question, not out of curiosity: each one consumes DDUs.
- Controlled cardinality:
topXfor calculated metrics, low-cardinality dimensions for logs and ingestion. - Several violating samples rather than one, and alert on the symptom (failure rate, latency): fewer false positives, less on-call fatigue.
- Version your selectors with dashboards and alerts: they are your SLIs.
Quiz
- What does
builtin:host.cpu.usage:fold(max)return? a) One series per minute b) One point per series: the maximum over the timeframe c) The average of all hosts d) An error - What does
:splitBy()without arguments do? a) Nothing b) Merges all dimensions into one series c) Splits by every dimension d) Removes null values - Which scope does
/api/v2/metrics/queryneed? a)ReadConfigb)metrics.ingestc)metrics.readd)entities.read - Which prefix does a calculated service metric start with? a)
builtin:b)calc:service.c)log.d)ext: - Which prefix is forbidden for ingestion? a)
custom.b)app.c)dt.d) none - What does
violatingSamples: 3withsamples: 5mean? a) 3 alerts over 5 days b) 3 violating minutes in a 5-minute window open the event c) 3% tolerance d) 5 retries
Answers
- b)
foldreduces the series to a single point with the requested aggregation. - b) All series are merged.
- c)
metrics.read. - b)
calc:service.. - c)
dt.is reserved for Dynatrace. - b) Samples last one minute.
Further reading
- Dynatrace Managed dashboards: tiles, Data Explorer and JSON
- Dynatrace Managed SLOs: configuration and API, where SLIs are metric selectors
- Davis, problems and alerting in Managed
- Metric selector (Dynatrace Managed documentation)
- Metric ingestion protocol (Dynatrace Managed documentation)
← Module 6: cloud and extensions · Course overview · End of the course
Frequently asked questions
Why does my query return fewer data points than requested?
Resolution is a target value: Dynatrace adjusts it to the timeframe and the age of the data. Older data is no longer available at minute level.
Does a calculated metric recover history?
No. It fills from its creation onwards. If you need the past, analyse existing traces in the service’s multidimensional analysis, then create the metric for the future.
Metric event or Davis automatic anomaly detection?
The two complement each other. Davis already watches services, applications and infrastructure with its automatic baselines. A metric event covers metrics Davis does not watch on its own: calculated, log or ingested metrics, or a precise contractual threshold.
You have finished the course: you can read a metric key, pick the right one for a host, service, application, process or cloud resource, query it with a selector and through the API, and create then monitor your own metrics. Keep the overview at hand as a cheat sheet.
span.observer is an independent community blog, not affiliated with Dynatrace LLC. This learning path does not replace the official Dynatrace University training and certifications. Check metric keys and features in the official documentation for your version.