
Course: Dynatrace SaaS metrics · Module 3/7 — dt.service metrics reference, requests, messaging and service mesh · Format: reference cards · Platform: Dynatrace SaaS (Grail, DQL)
In this module: 12 dt.service.* entries (requests, messaging, service mesh, calculated metrics), a summary table and one card per metric.
Third module of the Dynatrace SaaS metrics training: a dt.service metrics reference, laid out as cards. HTTP and RPC requests per endpoint, messaging (Kafka, RabbitMQ, SQS…) and service mesh: each card gives the unit, dimensions, a use case and a DQL query.
Service metrics measure what callers experience: how many requests arrive, how many fail and how long they take. They are the golden signals on which SLOs are built, and therefore the alerts that rightly wake someone up. Dynatrace produces them automatically for every detected endpoint, with no configuration.
This content applies to Dynatrace SaaS. For Dynatrace Managed, see the builtin service metrics module. Host keys are in module 2; this module is for finding the right service key and its quirks quickly.
dt.service metrics reference: summary table
Only twelve entries: on Grail, dimensions replace the proliferation of keys. Where Classic had one key for 4xx errors, one for 5xx and one for key requests, Grail keeps dt.service.request.count and lets you filter. Units and dimensions come from the reference page; “see descriptor” flags what it does not specify.
| Key | Unit | Main dimensions | What it measures |
|---|---|---|---|
dt.service.request.count |
count | dt.entity.service, endpoint.name, http.request.method, http.response.status_code, failed |
Requests received per endpoint |
dt.service.request.failure_count |
count | dt.entity.service, endpoint.name, http.request.method, http.response.status_code |
Failed requests per endpoint |
dt.service.request.response_time |
µs | dt.entity.service, endpoint.name, http.request.method, http.response.status_code, failed |
Response time of requests per endpoint |
dt.service.messaging.publish.count |
count | dt.entity.service, messaging.destination.name, messaging.system |
Messages sent to queues or topics |
dt.service.messaging.receive.count |
count | dt.entity.service, messaging.destination.name, messaging.system |
Messages received from queues or topics |
dt.service.messaging.process.count |
count | dt.entity.service, messaging.destination.name, messaging.system |
Messages processed successfully |
dt.service.messaging.process.duration |
see descriptor | dt.entity.service, messaging.destination.name, messaging.system |
Time spent processing messages |
dt.service.messaging.process.failure_count |
count | dt.entity.service, messaging.destination.name, messaging.system |
Messages whose processing failed |
dt.service.request.service_mesh.count |
count | see descriptor | Requests seen by the service mesh |
dt.service.request.service_mesh.failure_count |
count | see descriptor | Failed requests seen by the service mesh |
dt.service.request.service_mesh.response_time |
see descriptor | see descriptor | Response time seen by the service mesh |
service.<nom_de_la_métrique> |
as defined | Classic dimension + split placeholders | Calculated service metric, migrated from calc:service:… |
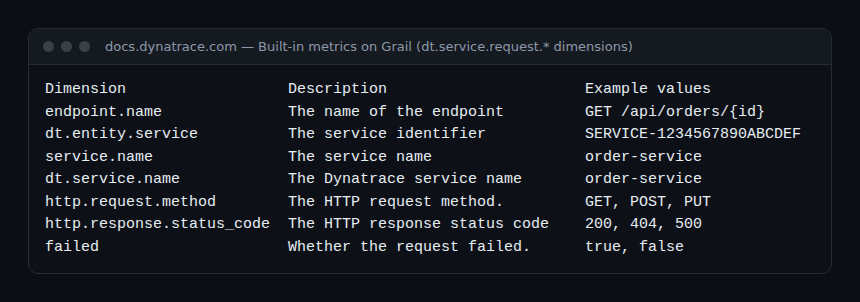
Reference cards: requests, messaging and service mesh
Same order on every card: purpose, use case, pitfall, DQL query. Infrastructure dimensions (k8s.namespace.name, k8s.cluster.name, aws.region, dt.host_group.id…) and primary_tags.* are also available on request and messaging metrics, with no topology join.
dt.service.request.count
Why it matters: traffic, the first golden signal, and the denominator of every failure rate.
Use case: one key replaces some thirty Classic keys (successes, 4xx, 5xx, key requests): you filter on http.response.status_code or failed instead of switching metric. Example: the share of 5xx responses for a service.
Pitfall: metrics are collected per minute: add rate: 1s if you want requests per second.
timeseries {all = sum(dt.service.request.count),
    s5xx = sum(dt.service.request.count, filter: {http.response.status_code >= 500}, default: 0)},
    by: {dt.entity.service}, union: true
| fieldsAdd pct_5xx = s5xx[] / all[] * 100
dt.service.request.failure_count
Why it matters: the numerator of the error rate, the basis of an availability SLI.
Use case: rank endpoints by failure count to know which one is burning the error budget.
Pitfall: the documentation states that the metric includes zero-count points for successful requests, to tell “failures”, “no failures” and “no requests” apart. A normal timeseries query does not return them: remember default: 0 in ratios.
timeseries failed = sum(dt.service.request.failure_count), by: {dt.entity.service, endpoint.name}
| sort arraySum(failed) desc
| limit 10
dt.service.request.response_time
Why it matters: latency, measured on the service side.
Use case: the 99th percentile per service, as in the DQL documentation example, to follow the tail of the distribution.
Pitfall: the unit is the microsecond: a 300 ms threshold is written 300000.
timeseries p99 = percentile(dt.service.request.response_time, 99),
    by: {dt.entity.service}
| limit 5
dt.service.messaging.publish.count
Why it matters: the throughput a service produces, on the sending side.
Use case: a drop to zero in publishing on a business-event topic signals a stuck producer before anyone complains.
Pitfall: these metrics exist only on Grail: there is no Classic equivalent to migrate.
timeseries pub = sum(dt.service.messaging.publish.count),
    by: {messaging.destination.name, messaging.system}
dt.service.messaging.receive.count
Why it matters: the consumer counterpart of publishing.
Use case: compare publishing and receiving on the same destination to see whether consumers keep up.
timeseries {pub = sum(dt.service.messaging.publish.count),
    rec = sum(dt.service.messaging.receive.count)},
    by: {messaging.destination.name}, union: true
dt.service.messaging.process.count
Why it matters: a consumer’s useful traffic.
Use case: compared with receive.count, it shows whether received messages are actually processed.
timeseries done = sum(dt.service.messaging.process.count, rate: 1m),
    by: {dt.entity.service, messaging.destination.name}
dt.service.messaging.process.duration
Why it matters: a consumer’s latency, invisible in HTTP request metrics.
Use case: processing time that doubles explains a backlog building up in the queue.
Pitfall: the reference page does not give the unit: read it in the metric browser before setting a threshold.
timeseries d = avg(dt.service.messaging.process.duration),
    by: {dt.entity.service, messaging.destination.name}
dt.service.messaging.process.failure_count
Why it matters: a consumer’s error rate.
Use case: failures concentrated on one destination point to a message format or a downstream dependency.
timeseries {ok = sum(dt.service.messaging.process.count),
    ko = sum(dt.service.messaging.process.failure_count, default: 0)},
    by: {messaging.destination.name}, union: true
| fieldsAdd fail_pct = ko[] / (ok[] + ko[]) * 100
dt.service.request.service_mesh.count
Why it matters: traffic measured by the mesh proxy rather than by instrumented code.
Use case: a lasting gap with dt.service.request.count reveals requests rejected by the proxy before they reach the application.
timeseries mesh = sum(dt.service.request.service_mesh.count, rate: 1s)dt.service.request.service_mesh.failure_count
Why it matters: captures network and proxy failures (timeouts, refused connections) that the application never sees.
Use case: a mesh failure rate to follow alongside the service’s during a mesh upgrade.
timeseries {all = sum(dt.service.request.service_mesh.count),
    ko = sum(dt.service.request.service_mesh.failure_count, default: 0)}, union: true
| fieldsAdd fail_pct = ko[] / all[] * 100
dt.service.request.service_mesh.response_time
Why it matters: includes the proxy’s cost: the difference with the service’s own time measures mesh overhead.
Use case: 90th percentile to watch after enabling mutual TLS.
Pitfall: compare like with like: check the unit in the descriptor before subtracting it from the service time.
timeseries p90 = percentile(dt.service.request.service_mesh.response_time, 90)service.<nom_de_la_métrique>
Why it matters: keeps a specific business need (amount, customer, order type) the built-in metrics do not cover.
Use case: an existing calc:service:orders metric becomes service.orders once enabled on Grail, with its placeholders turned into separate dimensions.
Pitfall: the documentation announces the deprecation of calculated service metrics, with no date set. For a new need, start from endpoint metrics or a metric extracted from spans in OpenPipeline.
timeseries sum(service.orders), by: {dt.entity.service}How to check it works
- In a notebook, run
timeseries sum(dt.service.request.count), by: {dt.entity.service}: every instrumented service should appear. - Add
endpoint.nametoby: if the column is empty for an SDv1 service, enable Enhanced endpoints as the documentation describes. - For messaging, filter on
messaging.system; no series at all often means the client library is not supported or not instrumented. - Compare a failure rate computed here with the service screen in the Services app: both should tell the same story.
Good practice
- Filter by dimension rather than looking for a dedicated key: HTTP status, method, endpoint.
- Use
default: 0andunion: truein ratios so services with no failures do not disappear. - Prefer percentiles to averages for latency, and convert thresholds to microseconds.
Going further: burn-rate alerts on SLOs turns these series into error-budget alerts, migrating SLOs to Grail covers the move from Classic keys, and Kafka context propagation explains why messaging metrics depend on correctly passed context. Sources: Built-in metrics on Grail and DQL metric commands.
← Module 2: Grail host metrics · Course overview · Module 4: RUM and synthetic metrics →
Frequently asked questions
Where did the key request metrics go?
There is no dedicated key any more: the old builtin:service.keyRequest.* keys map to the dt.service.request.* metrics, filtered by endpoint.name.
Does one query work for both SDv1 and SDv2?
Yes. According to the documentation, endpoint metrics are produced for SDv1 services (with Enhanced endpoints) and SDv2 services, and a single query covers both.
Should I still create calculated service metrics?
Not for a new need: they are announced as deprecated. Built-in metrics and their dimensions cover most splits; for the rest, extract a metric from spans with OpenPipeline.
With these twelve entries you cover latency, traffic and errors for your services, synchronous or asynchronous. The next module moves to the end-user side: RUM frontends and synthetic monitoring.
span.observer is an independent community blog, not affiliated with Dynatrace LLC. This module is an annotated selection, not the official list: keys, units and dimensions were taken from the public Dynatrace SaaS documentation and may change; check them in your environment’s metric browser.