
Course: Dynatrace SaaS metrics · Module 2/7 — dt.host metrics reference, CPU, memory, disk and network · Format: reference cards · Platform: Dynatrace SaaS (Grail, DQL)
In this module: 26 dt.host.* keys, a summary table and one card per metric with its DQL query.
This second module of the Dynatrace SaaS metrics training is a dt.host metrics reference: reference cards for the dt.host.* keys that OneAgent reports for every machine and that matter most in operations. Keep it open while on call: one line per metric, one query ready to copy.
Host metrics describe the layer everything runs on: CPU, memory, disks, network interfaces and availability, collected by OneAgent on Windows, Linux and AIX. They answer the question “is the machine coping?” and provide the saturation signal, the fourth golden signal alongside latency, traffic and errors.
This content applies to Dynatrace SaaS (Grail, DQL). For Dynatrace Managed, the builtin:host.* equivalents are covered in the hosts module of the Managed course. If the data model (keys, dimensions, the timeseries command) is new to you, start with module 1 on Grail metrics.
dt.host metrics reference: summary table
The 26 keys selected, grouped by family. Units come from the labels on the reference page; “see descriptor” means the documentation does not state it explicitly. The dimensions shown are those used in the documentation’s examples.
| Key | Unit | Main dimensions | What it measures |
|---|---|---|---|
dt.host.cpu.usage |
% | dt.entity.host |
Share of CPU in use, all modes combined |
dt.host.cpu.user |
% | dt.entity.host |
CPU time spent in user mode |
dt.host.cpu.system |
% | dt.entity.host |
CPU time spent in kernel mode |
dt.host.cpu.iowait |
% | dt.entity.host |
Idle CPU time waiting for I/O |
dt.host.cpu.steal |
% | dt.entity.host |
CPU time taken by the hypervisor for other virtual machines |
dt.host.cpu.load |
count (load) | dt.entity.host |
System load (load average), with the dt.host.cpu.load5m and dt.host.cpu.load15m variants |
dt.host.memory.usage |
% | dt.entity.host |
Memory used as a percentage |
dt.host.memory.avail.percent |
% | dt.entity.host |
Available memory as a percentage |
dt.host.memory.avail.bytes |
bytes | dt.entity.host |
Available memory in absolute terms |
dt.host.memory.used |
bytes | dt.entity.host |
Memory used in bytes |
dt.host.memory.avail.pfps |
page faults/s | dt.entity.host |
Page faults per second |
dt.host.memory.swap.used |
bytes | dt.entity.host |
Swap space used (see also swap.avail and swap.total) |
dt.host.disk.used.percent |
% | dt.entity.host, dt.entity.disk |
Disk space used, per disk |
dt.host.disk.avail |
bytes | dt.entity.host, dt.entity.disk |
Available disk space in bytes |
dt.host.disk.inodes_avail |
% | dt.entity.host, dt.entity.disk |
Available inodes as a percentage (Linux, excluding CIFS) |
dt.host.disk.queue_length |
count | dt.entity.host, dt.entity.disk |
Average disk queue length (excluding NFS, CIFS, GPFS) |
dt.host.disk.util_time |
see descriptor | dt.entity.host, dt.entity.disk |
Disk utilisation time (excluding NFS, CIFS, GPFS) |
dt.host.disk.bytes_read |
bytes/s | dt.entity.host, dt.entity.disk |
Read throughput (and dt.host.disk.bytes_written for writes) |
dt.host.disk.read_ops |
operations/s | dt.entity.host, dt.entity.disk |
Reads per second (IOPS), with dt.host.disk.write_ops |
dt.host.net.nic.bytes_rx |
bytes/s | dt.entity.host |
Bytes received per network interface (and bytes_tx for sending) |
dt.host.net.nic.link_util_rx |
% | dt.entity.host |
Link utilisation on receive (and link_util_tx) |
dt.host.net.nic.packets.dropped_rx |
packets/s | dt.entity.host |
Incoming packets dropped (and dropped_tx) |
dt.host.net.nic.packets.errors_rx |
packets/s | dt.entity.host |
Receive errors (and errors_tx) |
dt.host.availability |
count | dt.entity.host, availability.state |
Host availability state as seen by OneAgent |
dt.host.handles.file_descriptors_used |
count | dt.entity.host |
File descriptors used (and file_descriptors_max) |
dt.host.uptime |
duration | dt.entity.host |
Time since the host’s last boot |
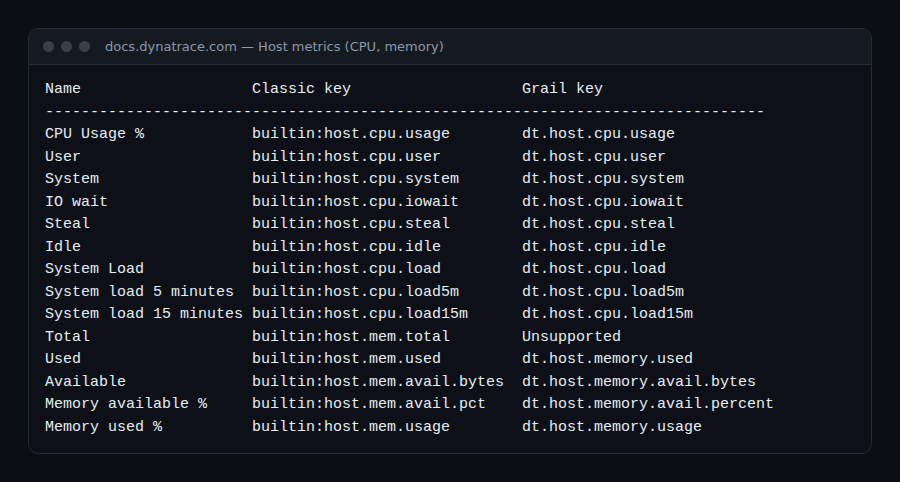
Reference cards: one host metric, one purpose
Each card follows the same order: purpose, use case, possible pitfall, DQL timeseries query. Any thresholds are examples to calibrate on your own history.
dt.host.cpu.usage
Why it matters: the first saturation indicator for a host, the one that goes on an on-call dashboard.
Use case: spot hosts that stay above your own capacity threshold (you set it; the documentation does not impose one) by comparing the average and the maximum over the same window.
Pitfall: a 24-hour average smooths out spikes; keep the max alongside before concluding a host is under-used.
timeseries {avg_cpu = avg(dt.host.cpu.usage), max_cpu = max(dt.host.cpu.usage)},
    by: {dt.entity.host}
| fieldsAdd host = entityName(dt.entity.host)
dt.host.cpu.user
Why it matters: tells you whether the load comes from the applications themselves.
Use case: if dt.host.cpu.usage rises and user follows, look at application processes (module 5) rather than the kernel.
timeseries {user = avg(dt.host.cpu.user), system = avg(dt.host.cpu.system)},
    by: {dt.entity.host}
dt.host.cpu.system
Why it matters: reveals the cost of system calls: heavy networking, many I/O operations, context switches.
Use case: a system share that stays above user on an application server deserves a look (driver, software firewall, third-party agent).
timeseries system = avg(dt.host.cpu.system), by: {dt.entity.host}
| sort arrayAvg(system) desc
| limit 10
dt.host.cpu.iowait
Why it matters: separates a host that is computing from a host waiting on its disk or network storage.
Use case: cross it with dt.host.disk.queue_length: both rising together point at storage.
Pitfall: the 20 in the query is an example to adapt, not a reference value.
timeseries iowait = max(dt.host.cpu.iowait), by: {dt.entity.host}
| filter arrayMax(iowait) > 20
dt.host.cpu.steal
Why it matters: on a VM or cloud instance, explains slowness that nothing inside the guest accounts for.
Use case: steal that appears at the same hours every day suggests a noisy neighbour or a burstable instance out of CPU credits; it is a platform-team topic, not an application one.
timeseries steal = avg(dt.host.cpu.steal), by: {dt.entity.host}
| filter arrayMax(steal) > 0
dt.host.cpu.load
Why it matters: counts tasks that are runnable or blocked, which a CPU percentage does not show.
Use case: compare load with the host’s core count; a 15-minute load that stays above the core count signals a standing queue.
Pitfall: load only means something relative to the core count; do not compare two hosts of different sizes on the raw value.
timeseries {l1 = avg(dt.host.cpu.load), l15 = avg(dt.host.cpu.load15m)},
    by: {dt.entity.host}
dt.host.memory.usage
Why it matters: the overall view of memory pressure.
Use case: a seven-day trend for capacity reviews; for alerting, prefer available memory below.
Pitfall: on Linux the file cache is reclaimable: a high percentage is not necessarily a problem.
timeseries mem = avg(dt.host.memory.usage), by: {dt.entity.host}, from: -7d, interval: 1hdt.host.memory.avail.percent
Why it matters: the signal that comes before swapping and the OOM killer.
Use case: alert when available memory falls below a floor you define, for example 10% for several minutes.
timeseries avail = min(dt.host.memory.avail.percent), by: {dt.entity.host}
| filter arrayMin(avail) < 10
dt.host.memory.avail.bytes
Why it matters: useful on large machines, where 5% still means several gigabytes.
Use case: check there is room to start one more instance of a service before a deployment.
timeseries avail = min(dt.host.memory.avail.bytes), by: {dt.entity.host}dt.host.memory.used
Why it matters: lets you sum consumption across a group of hosts.
Use case: estimate the memory a fleet really consumes before a migration or a resize.
Pitfall: total memory is not available on Grail according to the host metrics reference page: derive it from used + available if needed.
timeseries used = avg(dt.host.memory.used), by: {dt.host_group.id}dt.host.memory.avail.pfps
Why it matters: a high, sustained rate shows the system fetching pages from disk.
Use case: compare the curve with its usual level: the break in trend matters, not the absolute value.
timeseries pf = avg(dt.host.memory.avail.pfps), by: {dt.entity.host}dt.host.memory.swap.used
Why it matters: growing swap announces latency, long before an outage.
Use case: used / total ratio to follow the share of swap consumed.
timeseries {used = avg(dt.host.memory.swap.used), total = avg(dt.host.memory.swap.total)},
    by: {dt.entity.host}
| fieldsAdd swap_pct = used[] / total[] * 100
dt.host.disk.used.percent
Why it matters: the most readable fill-level metric.
Use case: list the fullest volumes in production.
timeseries used = max(dt.host.disk.used.percent), by: {dt.entity.host, dt.entity.disk}
| fieldsAdd disk = entityName(dt.entity.disk)
| sort arrayLast(used) desc
| limit 20
dt.host.disk.avail
Why it matters: the basis for fill-up forecasts.
Use case: project the date a volume will be full (Dynatrace forecast analysis takes this family of metrics as input).
Pitfall: dt.host.disk.free is not a byte count: the reference page maps it to available disk space as a percentage.
timeseries avail = avg(dt.host.disk.avail), by: {dt.entity.disk}, interval: 1h, from: -7ddt.host.disk.inodes_avail
Why it matters: a disk can be “full” with free space left if inodes run out.
Use case: log or message-queue volumes that create millions of small files.
timeseries inodes = min(dt.host.disk.inodes_avail), by: {dt.entity.host, dt.entity.disk}
| filter arrayMin(inodes) < 15
dt.host.disk.queue_length
Why it matters: measures disk saturation, where space only measures fill level.
Use case: a queue that stays high during a service latency spike links the symptom to its cause.
timeseries q = avg(dt.host.disk.queue_length), by: {dt.entity.host, dt.entity.disk}dt.host.disk.util_time
Why it matters: shows how long the disk is busy serving requests.
Use case: on a local disk, near-maximum busy time during backups explains slow nights.
Pitfall: check the unit in the metric browser before setting a threshold; the reference table does not give it.
timeseries util = avg(dt.host.disk.util_time), by: {dt.entity.disk}dt.host.disk.bytes_read
Why it matters: gives the volume transferred, to compare with storage limits.
Use case: on a throughput-capped cloud disk, a flat plateau on the curve signals the limit has been reached.
timeseries {r = avg(dt.host.disk.bytes_read), w = avg(dt.host.disk.bytes_written)},
    by: {dt.entity.host}
dt.host.disk.read_ops
Why it matters: cloud disks are often capped on IOPS before throughput.
Use case: compare reads + writes with the volume’s provisioned IOPS.
timeseries {r = avg(dt.host.disk.read_ops), w = avg(dt.host.disk.write_ops)},
    by: {dt.entity.disk}
| fieldsAdd iops = r[] + w[]
dt.host.net.nic.bytes_rx
Why it matters: a host’s raw traffic, for sizing and anomaly detection.
Use case: a sudden drop in traffic received by a load-balancer node shows it no longer gets requests.
timeseries {rx = avg(dt.host.net.nic.bytes_rx), tx = avg(dt.host.net.nic.bytes_tx)},
    by: {dt.entity.host}
dt.host.net.nic.link_util_rx
Why it matters: relates traffic to the card’s capacity.
Use case: an interface close to capacity explains packet loss and growing response times.
timeseries {rx = max(dt.host.net.nic.link_util_rx), tx = max(dt.host.net.nic.link_util_tx)},
    by: {dt.entity.host}
dt.host.net.nic.packets.dropped_rx
Why it matters: drops point to saturated buffers or an overloaded interface.
Use case: any recurring non-zero value deserves a ticket; match it with retransmissions on the application side.
timeseries dropped = sum(dt.host.net.nic.packets.dropped_rx), by: {dt.entity.host}
| filter arraySum(dropped) > 0
dt.host.net.nic.packets.errors_rx
Why it matters: errors point more to hardware or drivers than to load.
Use case: errors on a single host in an otherwise identical group point to a cable, port or card.
timeseries errors = sum(dt.host.net.nic.packets.errors_rx), by: {dt.entity.host}dt.host.availability
Why it matters: the foundation of an infrastructure SLI.
Use case: count hosts in a state other than “up” to detect a shutdown or a lost agent connection.
Pitfall: an unavailable host can also be a stopped OneAgent; check before opening a hardware incident.
timeseries n = sum(dt.host.availability, default: 0),
    by: {availability.state}
dt.host.handles.file_descriptors_used
Why it matters: running out of descriptors blocks new connections without saturating CPU or memory.
Use case: follow the used / max ratio on highly concurrent servers (proxies, databases).
timeseries {used = max(dt.host.handles.file_descriptors_used),
    max = max(dt.host.handles.file_descriptors_max)},
    by: {dt.entity.host}
| fieldsAdd fd_pct = used[] / max[] * 100
dt.host.uptime
Why it matters: confirms an unexpected reboot during an incident.
Use case: a value that drops close to zero at the time of an error spike explains the outage.
Pitfall: the Grail metrics list includes dt.host.uptime, but the host metrics reference page still shows the Classic key in its Grail column: check it exists in your environment before relying on it.
timeseries up = min(dt.host.uptime), by: {dt.entity.host}How to check it works
- Open a notebook and run
timeseries avg(dt.host.cpu.usage), by: {dt.entity.host}over the last two hours: one series per host should appear. - If a key from this module returns nothing, look it up in the metric browser: some depend on the operating system (AIX, Linux) or the disk type (notes on the reference page).
- Compare a value with the host screen in the Infrastructure app: orders of magnitude should match.
- If no host metrics arrive at all, check that OneAgent runs in Full-Stack or Infrastructure mode; Discovery mode only sends part of the metrics.
Good practice
- Alert on available memory, inodes and disk queue; keep average CPU for capacity planning.
- Group by
dt.entity.hostordt.host_group.id, never by a volatile dimension. - Calibrate every threshold on two to four weeks of history before waking anyone up.
Going further: the DQL timeseries training details the parameters used here (by, interval, default), and burn-rate alerts on SLOs shows how to turn a metric into a useful alert. Sources: Built-in metrics on Grail and Host metrics.
← Module 1: Grail metrics · Course overview · Module 3: Grail service metrics →
Frequently asked questions
Why does this module not list total host memory?
The host metrics reference page marks total memory as unsupported on Grail. Add used and available memory if you need an order of magnitude.
Which dimension should I use to group by host?
dt.entity.host, turned into a readable name with entityName(). For disk metrics, add dt.entity.disk to tell volumes apart.
Do these cards apply to Dynatrace Managed?
No. Managed has neither Grail nor DQL: it uses the builtin:host.* keys and the metric selector. The Managed course follows the same structure so you can find your way around.
These twenty-six keys cover most of a host diagnosis. The next module moves one layer up to services: requests, failures, messaging and service mesh.
span.observer is an independent community blog, not affiliated with Dynatrace LLC. This module is an annotated selection, not the official list: keys, units and dimensions were taken from the public Dynatrace SaaS documentation and may change; check them in your environment’s metric browser.