Course: Dynatrace SaaS metrics · Module 6/7 — Grail cloud metrics (AWS, Azure, VMware) and extensions · Format: reference cards · Platform: Dynatrace SaaS (Grail, DQL)
In this module:
- A summary table of 21
dt.cloud.*and extension metrics. - One card per metric: what it measures, when to use it, the trap to avoid and a
timeseriesquery. - The three naming rules that let you find an extension metric in Grail.
This sixth module of the Dynatrace SaaS metrics training gathers the Grail cloud metrics: the ones Dynatrace collects from AWS, Azure and VMware, then the ones extensions bring in. These are the metrics you open when a Lambda function starts failing, when a managed database saturates, or when a PaaS service responds slowly although no OneAgent runs on it. Each card gives the exact key, its unit and a DQL query ready to adapt.
This whole module applies to Dynatrace SaaS with Grail and DQL. In Dynatrace Managed, the same signals use classic builtin:cloud.* keys queried with the metric selector: they are covered in the Managed cloud metrics module.
The cards go straight to the key. For the data model (keys, dimensions, mapping to classic keys), revisit the Grail metrics module of the course.
Grail cloud metrics in one table
The dt.cloud.* keys below appear in the mapping table of the Built-in Metrics on Grail page. The rule is simple: builtin:cloud. becomes dt.cloud. and camelCase turns into snake_case (errorsRate becomes errors_rate). Units are those of the classic equivalent, documented on each service’s page. The main dimension is the one named by the service documentation; in Grail, open the metrics browser to read the exact dimension names before adding a by:.
| Grail key | Unit | Main dimension (docs) | What it measures |
|---|---|---|---|
dt.cloud.aws.lambda.invocations |
count | FunctionName | Invocations of a Lambda function |
dt.cloud.aws.lambda.duration |
millisecond | FunctionName | Code execution time |
dt.cloud.aws.lambda.errors_rate |
% | FunctionName | Share of failed invocations |
dt.cloud.aws.lambda.throttlers |
count | FunctionName | Throttled invocations |
dt.cloud.aws.lambda.conc_executions |
count | FunctionName | Concurrent executions |
dt.cloud.aws.ec2.cpu.usage |
% | InstanceId | CPU of an EC2 instance |
dt.cloud.aws.rds.cpu.usage |
% | DBInstanceIdentifier | CPU of an RDS instance |
dt.cloud.aws.rds.connections |
count | DBInstanceIdentifier | Database connections |
dt.cloud.aws.rds.latency.read |
second | DBInstanceIdentifier | Read latency |
dt.cloud.aws.rds.free |
% | DBInstanceIdentifier | Free storage space |
dt.cloud.aws.alb.errors.target.http5xx |
count | LoadBalancer | 5xx errors returned by targets |
dt.cloud.aws.alb.resp_time |
second | LoadBalancer | Target response time |
dt.cloud.azure.app_service.response.avg |
second | App Service app | Average response time |
dt.cloud.azure.app_service.http.status.http5xx |
count | App Service app | HTTP 5xx responses |
dt.cloud.azure.sql_database.dtu.consumption_perc |
% | SQL database | DTU consumption |
dt.cloud.azure.sql_database.deadlocks |
count | SQL database | Deadlocks |
dt.cloud.azure.redis.cache.misses |
count | Redis cache | Reads missing the cache |
dt.cloud.azure.redis.load |
% | Redis cache | Redis server load |
dt.cloud.vmware.vm.cpu.ready_perc |
% | virtual machine | Time spent waiting for a physical CPU |
cloud.aws.dx.connection_error_count |
per extension | per extension | Example of a renamed ext: extension metric |
cloud.gcp.cloudfunctions_googleapis_com.function.active_instances |
per extension | per extension | Example of a Google Cloud metric with no common prefix |
AWS Lambda
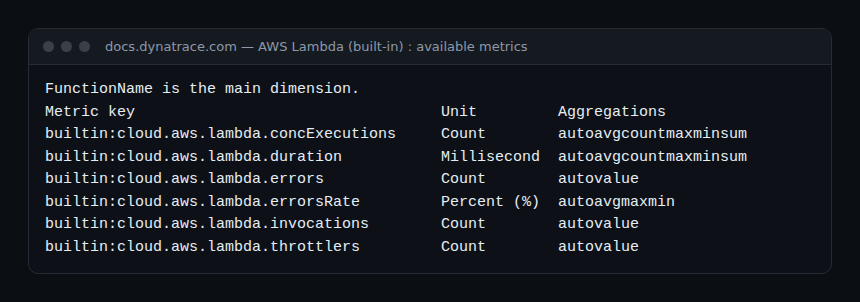
Lambda functions have no host to monitor: the CloudWatch metrics collected by the AWS integration are often the only signal available. The documentation names FunctionName as the main dimension.
dt.cloud.aws.lambda.invocations
Number of calls to a function. This is the traffic golden signal: a sudden drop often points to a broken event source (empty queue, disabled trigger) rather than a failing function. Also use it as the denominator of your own ratios.
timeseries inv = sum(dt.cloud.aws.lambda.invocations)dt.cloud.aws.lambda.duration
Code execution time, in milliseconds. Compare the maximum with the configured timeout: a function getting close to it will end up timing out under load. Trap: the average hides cold starts, so look at the maximum too.
timeseries {
    mean = avg(dt.cloud.aws.lambda.duration),
    peak = max(dt.cloud.aws.lambda.duration)
  }
dt.cloud.aws.lambda.errors_rate
Share of failed invocations, as a percentage. It is the natural candidate for a function availability SLI. Trap: the neighbouring key dt.cloud.aws.lambda.errors is an absolute counter; do not compare a counter between two functions with very different traffic.
timeseries rate = avg(dt.cloud.aws.lambda.errors_rate)dt.cloud.aws.lambda.throttlers
Invocations rejected by AWS for lack of available concurrency. Any lasting non-zero value deserves an alert: synchronous calls are lost for the caller, asynchronous calls are delayed.
timeseries throttled = sum(dt.cloud.aws.lambda.throttlers)dt.cloud.aws.lambda.conc_executions
Number of concurrent executions. Compared with the account or function concurrency limit, it anticipates throttling. Aggregate with max: an average over an interval smooths out exactly the peaks that cause throttling.
timeseries conc = max(dt.cloud.aws.lambda.conc_executions)EC2, RDS and AWS load balancers
dt.cloud.aws.ec2.cpu.usage
CPU of an EC2 instance as seen by CloudWatch, as a percentage. Useful for instances without OneAgent. When OneAgent is installed, prefer dt.host.cpu.usage (see module 2: Grail host metrics), which is finer and richer in dimensions.
timeseries cpu = avg(dt.cloud.aws.ec2.cpu.usage)dt.cloud.aws.rds.cpu.usage
CPU of an RDS instance. A CPU-bound database slows down every service that calls it: cross this curve with service-side response time before hunting for the problem in the code.
timeseries cpu = avg(dt.cloud.aws.rds.cpu.usage)dt.cloud.aws.rds.connections
Number of open connections to the database. A steady rise with no rise in traffic often reveals a connection leak in an application pool. Compare it with the connection limit of your instance class.
timeseries conns = max(dt.cloud.aws.rds.connections)dt.cloud.aws.rds.latency.read
Average latency of the database’s disk reads. Trap: the unit is the second, not the millisecond; a value of 0.02 already means 20 ms. Convert before displaying it or setting a threshold.
timeseries lat = avg(dt.cloud.aws.rds.latency.read)
| fieldsAdd lat_ms = lat[] * 1000
dt.cloud.aws.rds.free
Free storage space, as a percentage. A full disk stops writes: the kind of incident that takes long to fix once it happens. Follow the trend rather than the instant value.
timeseries free = min(dt.cloud.aws.rds.free)dt.cloud.aws.alb.errors.target.http5xx
Number of 5xx responses produced by the targets behind an Application Load Balancer. Keep it apart from dt.cloud.aws.alb.errors.alb.http5xx, which counts the 5xx generated by the load balancer itself (unreachable target, for example): the two are not fixed in the same place.
timeseries {
    targets = sum(dt.cloud.aws.alb.errors.target.http5xx),
    alb = sum(dt.cloud.aws.alb.errors.alb.http5xx)
  }
dt.cloud.aws.alb.resp_time
Target response time measured by the ALB, in seconds. It gives a latency seen from the system’s entry point, useful when the targets are not instrumented.
timeseries rt = avg(dt.cloud.aws.alb.resp_time)Azure and VMware
dt.cloud.azure.app_service.response.avg
Average response time of an App Service application, in seconds. A good first-level indicator for a Web App without OneAgent; for percentiles you need traces.
timeseries rt = avg(dt.cloud.azure.app_service.response.avg)dt.cloud.azure.app_service.http.status.http5xx
Number of HTTP 5xx responses. Divide it by dt.cloud.azure.app_service.traffic.requests to get an error rate you can compare between applications.
timeseries {
    err = sum(dt.cloud.azure.app_service.http.status.http5xx),
    req = sum(dt.cloud.azure.app_service.traffic.requests)
  }
| fieldsAdd rate = 100 * err[] / req[]
dt.cloud.azure.sql_database.dtu.consumption_perc
DTU consumption (capacity units of the DTU purchasing model) of an Azure SQL database, as a percentage. A database staying close to 100% is throttled by Azure: queries get longer with no visible error. Does not apply to databases on the vCore model.
timeseries dtu = max(dt.cloud.azure.sql_database.dtu.consumption_perc)dt.cloud.azure.sql_database.deadlocks
Number of deadlocks. A sudden appearance after a deployment almost always points to a change in table access order: link this signal to deployment events.
timeseries dl = sum(dt.cloud.azure.sql_database.deadlocks)dt.cloud.azure.redis.cache.misses
Reads that do not find the key in the cache. Compared with dt.cloud.azure.redis.cache.hits, it gives the cache hit ratio; a drop in that ratio shifts the load onto the database.
timeseries {
    hits = sum(dt.cloud.azure.redis.cache.hits),
    miss = sum(dt.cloud.azure.redis.cache.misses)
  }
| fieldsAdd hit_ratio = 100 * hits[] / (hits[] + miss[])
dt.cloud.azure.redis.load
Redis server load, as a percentage. Redis processes commands on a main thread: a high load turns into latency for every client, even when the machine’s overall CPU looks moderate.
timeseries load = max(dt.cloud.azure.redis.load)dt.cloud.vmware.vm.cpu.ready_perc
Share of time a virtual machine waits for a free physical CPU. A high value signals an overloaded hypervisor: the VM slows down although its own CPU looks available. The acceptable threshold depends on your platform; agree on it with the virtualisation team.
timeseries ready = avg(dt.cloud.vmware.vm.cpu.ready_perc)Finding extension metrics in Grail
Extensions (Extensions 2.0, ActiveGate, older 1.0 extensions) and additional cloud services produce thousands of keys: carding them one by one is impossible. The documentation gives three naming rules, summarised in the screenshot below.
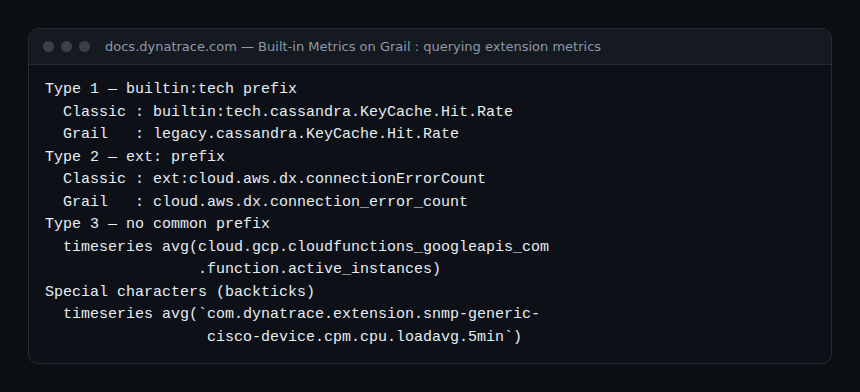
builtin:techprefix (1.0 extensions): the key becomeslegacy.*, for examplelegacy.cassandra.KeyCache.Hit.Rate. Exceptions:builtin:tech.genericandbuiltin:tech.webspheremetrics, and runtime metrics such as the JVM ones, which have their own Grail keys (see module 5).ext:prefix: remove the prefix and convert camelCase to snake_case, except for proper nouns such asroute53resolver.- No common prefix: query the key as is; if it contains a special character (hyphen, numeric segment), wrap it in backticks.
cloud.aws.dx.connection_error_count
Documented example of rule 2: the classic key ext:cloud.aws.dx.connectionErrorCount (AWS Direct Connect connection errors) becomes cloud.aws.dx.connection_error_count. Apply the same transformation to any ext: metric before concluding it is missing from Grail.
timeseries err = sum(cloud.aws.dx.connection_error_count)cloud.gcp.cloudfunctions_googleapis_com.function.active_instances
Documented example of rule 3: a Google Cloud metric (active instances of a Cloud Function) queried unchanged. For a key with a hyphen, the documentation gives the example `com.dynatrace.extension.snmp-generic-cisco-device.cpm.cpu.loadavg.5min`.
timeseries inst = avg(cloud.gcp.cloudfunctions_googleapis_com.function.active_instances)How to check that it works
- Open a notebook and run
timeseries sum(dt.cloud.aws.lambda.invocations)(or an Azure key from your scope) over the last 24 hours: a series should come back. Nothing comes back: check that the cloud integration is configured and that the service is ticked in its list of services. - Run
load "/dt/platform/metrics.metadata" | filter startsWith(metric.key, "dt.cloud.")to list the cloud keys known to your environment, with their unit and dimensions. - Before adding a
by:, open the key in the metrics browser to read the exact names of its dimensions in Grail. - CloudWatch metrics arrive with a delay: test your alerts on a window of several minutes, not on the last minute.
The queries in this module follow the syntax detailed in DQL timeseries: the advanced guide. To set up the AWS integration, see Dynatrace AWS: CloudWatch metrics and logs; on the Azure side, Dynatrace Azure and Azure Monitor.
Frequently asked questions
Why do some classic AWS metrics not exist in Grail?
The documentation lists the classic AWS metrics not supported on Grail, notably the internal builtin:cloud.aws.cloudwatch.* metrics that describe the state of the collection. Service metrics (Lambda, EC2, RDS, ALB…) do have their dt.cloud.aws.* equivalent.
Should I prefer dt.cloud.* or OneAgent metrics?
When OneAgent runs on the machine, its metrics (dt.host.*, dt.process.*) are finer. dt.cloud.* metrics are for managed services where no agent is possible: functions, managed databases, load balancers, caches.
How do I know whether an extension metric is already in Grail?
Apply the three naming rules, then search for the key in load "/dt/platform/metrics.metadata". If it still does not show up, read the extension’s documentation: some calculated metrics are not yet supported on Grail.
With these 21 cards, modules 2 to 6 cover the whole stack, from the host to managed cloud services. The last module shows how to query these metrics precisely, create your own and raise alerts.
← Module 5: Grail Kubernetes metrics · Course overview · Module 7: DQL timeseries and alerts →
span.observer is an independent community blog, not affiliated with Dynatrace LLC. This module does not replace the official documentation: check every key, unit and dimension in the documentation and in your environment’s metrics browser.