
Module 3 of the Dynatrace Managed metrics course, a builtin service metrics reference for Dynatrace Managed: 20 builtin:service.* metrics to track traffic, latency, errors, key requests and database calls, with one metric selector query per entry.
Learning path: Dynatrace Managed metrics training · Module 3/7 · Domain: services, requests, databases · Platform: Dynatrace Managed (Metrics API v2, metric selector)
Users do not see a host; they see a service that answers slowly or with an error. Service metrics therefore carry the golden signals: traffic, latency, errors, and part of saturation through time spent in databases or waiting. They feed most SLOs.
Module 2 covered hosts; this module moves one layer up. Every entry follows the same outline: what it measures, use, pitfall, query.
The content applies to Dynatrace Managed and to classic metrics in Dynatrace SaaS. On Grail, the keys become dt.service.* and are queried with DQL.
Builtin service metrics: the summary table
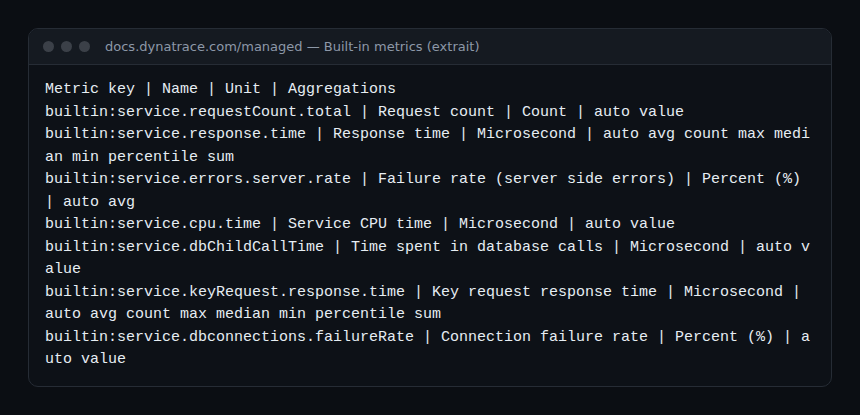
Source: the Built-in metrics page of the Managed documentation. The main dimension is dt.entity.service; keyRequest metrics split by key request (dt.entity.service_method). Watch out: times are in microseconds.
| Key | Unit | Aggregations | What it measures |
|---|---|---|---|
builtin:service.requestCount.total |
Count | value | Requests received |
builtin:service.requestCount.server |
Count | value | Requests measured server side |
builtin:service.response.time |
Microsecond | avg, count, max, median, min, percentile, sum | Response time |
builtin:service.response.server |
Microsecond | avg, count, max, median, min, percentile, sum | Server-side response time |
builtin:service.errors.total.count |
Count | value | Failed requests (any) |
builtin:service.errors.total.rate |
% | avg | Failure rate (any) |
builtin:service.errors.server.count |
Count | value | Server-side failures |
builtin:service.errors.server.rate |
% | avg | Server-side failure rate |
builtin:service.errors.fivexx.count |
Count | value | HTTP 5xx responses |
builtin:service.errors.fourxx.count |
Count | value | HTTP 4xx responses |
builtin:service.successes.server.rate |
% | avg | Server-side success rate |
builtin:service.cpu.time |
Microsecond | value | CPU used by the service |
builtin:service.cpu.perRequest |
Microsecond | avg, count, max, min, sum | CPU per request |
builtin:service.dbChildCallCount |
Count | value | Database calls |
builtin:service.dbChildCallTime |
Microsecond | value | Time in database calls |
builtin:service.nonDbChildCallCount |
Count | value | Calls to other services |
builtin:service.dbconnections.failureRate |
% | value | Database connection failures |
builtin:service.keyRequest.response.time |
Microsecond | avg, count, max, median, min, percentile, sum | Key request response time |
builtin:service.keyRequest.count.total |
Count | value | Key request volume |
builtin:service.keyRequest.errors.server.rate |
% | avg | Key request failure rate |
Traffic and latency
builtin:service.requestCount.total
The number of requests received by the service; the documentation notes that it supports service splittings. This is the traffic signal. A sudden drop deserves as much attention as an error spike: it often betrays an upstream problem.
builtin:service.requestCount.total:splitBy("dt.entity.service"):sort(value(sum,descending)):limit(10)builtin:service.requestCount.server
The same count, measured on the server side only. It is the consistent denominator when you compute a rate from server-side errors.
builtin:service.requestCount.server:splitBy("dt.entity.service")builtin:service.response.time
The time the service takes to send its response, in microseconds. Prefer a percentile to the average: a p90 describes what most users get without being dragged down by a few very fast requests. Divide by 1,000 to read milliseconds.
builtin:service.response.time:splitBy("dt.entity.service"):percentile(90):sort(value(max,descending)):limit(10)builtin:service.response.server
Server-side response time, without the part measured on the calling client. The gap between the two reveals network or queueing time on the caller’s side.
builtin:service.response.server:splitBy("dt.entity.service"):medianErrors and successes
builtin:service.errors.total.count
Failed requests, measured server side or client side. What counts as a failure depends on the failure detection configured for the service: check that setting before building an SLO on it.
builtin:service.errors.total.count:splitBy("dt.entity.service"):sort(value(sum,descending)):limit(10)builtin:service.errors.total.rate
The failure rate for any error, as a percentage, with avg as its only aggregation. Handy on a dashboard; for an SLO, compute the ratio yourself to control the denominator.
builtin:service.errors.total.rate:splitBy("dt.entity.service"):avgbuiltin:service.errors.server.count
Failures measured on the server side. This is the counter to favour for a reliability indicator of the service itself, independent of its clients.
builtin:service.errors.server.count:splitBy("dt.entity.service")builtin:service.errors.server.rate
The server-side failure rate. A sudden rise after a deployment is the textbook case for a metric event or a burn-rate alert.
builtin:service.errors.server.rate:splitBy("dt.entity.service"):avg:sort(value(avg,descending)):limit(10)builtin:service.errors.fivexx.count
HTTP responses with a status code between 500 and 599. They point to a failure of the service or one of its dependencies.
builtin:service.errors.fivexx.count:splitBy("dt.entity.service")builtin:service.errors.fourxx.count
HTTP 4xx responses. Classic pitfall: a spike of 404 or 401 often comes from a misconfigured client, not the service. Do not feed it into an error budget as is.
builtin:service.errors.fourxx.count:splitBy("dt.entity.service")builtin:service.successes.server.rate
The server-side success rate, as a percentage. It is the most direct form of an availability SLI; the article on SLOs in Dynatrace Managed shows how to use it.
builtin:service.successes.server.rate:splitBy("dt.entity.service"):avgConsumption and dependencies
builtin:service.cpu.time
The CPU time consumed by the service, in microseconds. It links a CPU increase on the host to a specific service, and lets you compare two versions of the same code.
builtin:service.cpu.time:splitBy("dt.entity.service"):sort(value(sum,descending)):limit(10)builtin:service.cpu.perRequest
CPU consumed per request. Unlike the total, it does not grow with traffic: an increase means a request has become more expensive, often after a code change.
builtin:service.cpu.perRequest:splitBy("dt.entity.service"):avgbuiltin:service.dbChildCallCount
The number of database calls made by the service. A calls-per-request ratio that explodes betrays the N+1 pattern, common with ORMs.
builtin:service.dbChildCallCount:splitBy("dt.entity.service") / builtin:service.requestCount.total:splitBy("dt.entity.service")builtin:service.dbChildCallTime
Time spent in database calls, in microseconds. Compared with response time, it tells you whether slowness comes from the database or from the service code.
builtin:service.dbChildCallTime:splitBy("dt.entity.service")builtin:service.nonDbChildCallCount
The number of calls to other services; nonDbChildCallTime gives the matching time. A rise in that time steers the analysis towards a downstream dependency. In the same family, builtin:service.ioTime, lockTime and waitTime (microseconds) break down I/O, lock and wait time.
builtin:service.nonDbChildCallCount:splitBy("dt.entity.service")builtin:service.dbconnections.failureRate
The rate of failed database connection attempts against all attempts. A saturated pool or an unreachable database shows up here before application errors.
builtin:service.dbconnections.failureRate:splitBy("dt.entity.service")Key requests
A key request is an entry point you mark as critical (payment, login). Dynatrace then writes dedicated metrics for each one.
builtin:service.keyRequest.response.time
The response time of a key request, in microseconds. This is the right grain for a latency SLO on a business journey: secondary requests no longer dilute the signal.
builtin:service.keyRequest.response.time:splitBy("dt.entity.service_method"):percentile(95)builtin:service.keyRequest.count.total
The number of requests for a key request. It is the SLO denominator and a business signal: a drop in payment volume shows up here.
builtin:service.keyRequest.count.total:splitBy("dt.entity.service_method")builtin:service.keyRequest.errors.server.rate
The server-side failure rate of a key request. Together with response time, it covers the two most used SLIs on a critical entry point.
builtin:service.keyRequest.errors.server.rate:splitBy("dt.entity.service_method"):avgHow to check that it works
- List the available service keys:
curl -s "$DT_URL/api/v2/metrics?metricSelector=builtin:service.*&fields=unit,aggregationTypes" \ -H "Authorization: Api-Token $DT_TOKEN" - Run a query from this module:
curl -s -G "$DT_URL/api/v2/metrics/query" \ --data-urlencode 'metricSelector=builtin:service.response.time:percentile(90):splitBy("dt.entity.service")' \ --data-urlencode 'from=now-2h' \ -H "Authorization: Api-Token $DT_TOKEN" - Compare a value with the chart on the service page: divided by 1,000, the microseconds should match the milliseconds shown.
keyRequest metrics return nothing until a request is marked as key. The metric selector syntax is covered in the metric selector and API module.
Best practices
- Read times in microseconds and convert before comparing with a target in milliseconds.
- Use a percentile for latency and a success/total ratio for availability.
- Keep 4xx and 5xx apart: usually only the latter reflects the service’s reliability.
- Mark critical journeys as key requests to get metrics at the right grain.
Frequently asked questions
What is the difference between errors.total and errors.server?
The first counts failures measured server side or client side, the second only server side. To judge the service itself, start from the server side.
Where are databases in this module?
Seen from the calling service: calls, time and connection failures. Internal metrics of a database engine belong to extensions (module 6).
Do these keys exist on Grail?
dt.service.* equivalents exist on Dynatrace SaaS with Grail, sometimes with different names and units; the SaaS metrics course covers them.
With hosts and services, you hold both server-side layers. The next module moves to the user side: web and mobile applications, Apdex and synthetic monitors.
← Module 2: hosts · Course overview · Module 4: applications →
span.observer is an independent community blog, not affiliated with Dynatrace LLC. The keys and units quoted come from the official Dynatrace Managed documentation; check them against your cluster version.