dtwiz Dynatrace is a command-line tool, published on GitHub under the dynatrace-oss organisation, that analyses a machine and then installs the Dynatrace data-collection method that suits it. Dynatrace SaaS 1.347 (rollout started on 16 September 2026) puts it forward in three announcements: a renewed QuickStart flow, host monitoring set up during the OpenTelemetry collector installation, and general availability of OpenTelemetry hosts in Infrastructure & Operations.
For an SRE team the appeal is simple: shorten the time between “a machine with no monitoring” and “the first host metrics in the tool”. Fewer manual steps mean less toil and fewer forgotten machines. This article covers what the release notes and the repository say, read on 27 October 2026, and gives the commands as they appear in the README.
A note on honesty: span.observer is an independent blog and has neither installed nor run dtwiz to write these lines. The screenshots are either extracts of the README rendered from its text, an image from the repository README (Apache 2.0 licence), or a page of the official documentation. The scope is Dynatrace SaaS: none of this applies to Dynatrace Managed.
dtwiz Dynatrace: what the repository says
- What it is: a Go tool called the “Dynatrace Ingest CLI” in its README. It detects the platform, containers, Kubernetes, existing agents, cloud and services, then recommends a method.
- Licence: the LICENSE file is the Apache License 2.0 text.
- Maturity: the README says “early development” and asks users to open a GitHub issue for bugs. I could not read a published version number; the repository moves quickly.
- Telemetry to your tenant: on every command, dtwiz sends a
CUSTOM_INFOevent to your environment. The README warns that these events count against the event-ingest quota.
The main commands listed in the README: dtwiz setup (interactive analyse, recommend, install flow), dtwiz analyze, dtwiz recommend, dtwiz install (oneagent, kubernetes, otel, otel-collector, otel-java, otel-node, otel-python, demo, aws, aws-lambda, azure, gcp; docker is marked experimental), dtwiz uninstall, dtwiz update, dtwiz watch and dtwiz status.
What changes in Dynatrace SaaS 1.347
The page “What’s new in Dynatrace SaaS 1.347” (rollout of 16 September 2026, updated on 6 October 2026) holds four items related to our topic. They carry no individual dates; the wording below is mine.
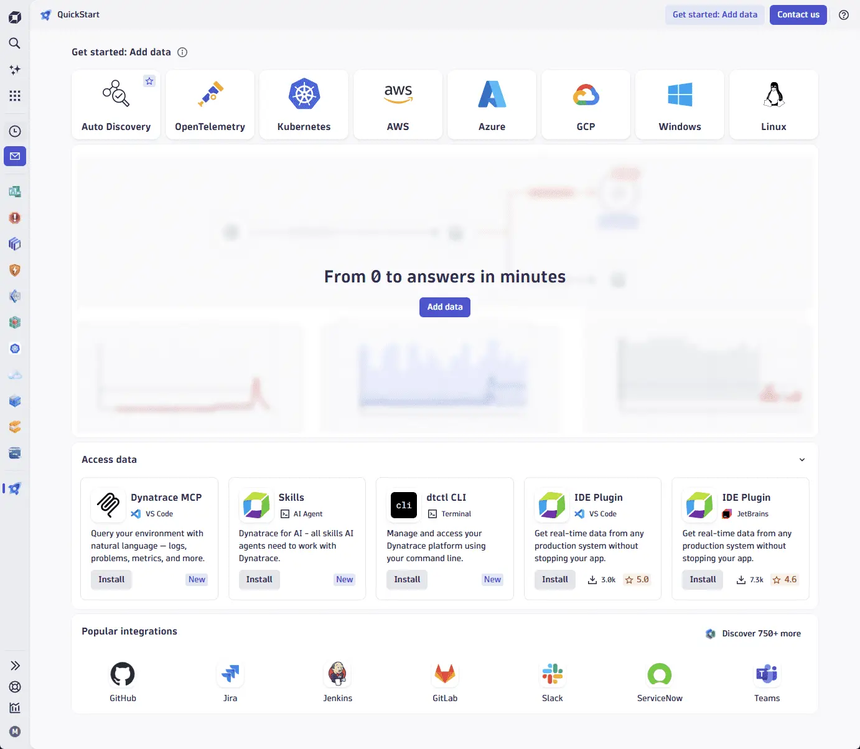
- QuickStart: an updated guided dtwiz flow, with the manual onboarding wizards gathered under “Manual install” and the option to instrument the Schnitzel demo application through
dtwiz setup. - Dynatrace Assist in QuickStart: AI explanations of findings and topology search for services.
- Host monitoring with dtwiz: during the OpenTelemetry collector installation, dtwiz prepares the required OpenTelemetry extension and the OpenPipeline dynamic routes. According to the note, host metrics appear in Infrastructure & Operations within minutes; you reach it from QuickStart under “Add more data”.
- OpenTelemetry hosts generally available: they appear in the Compute menu of Infrastructure & Operations, alongside OneAgent. The Datacenter concept is removed from the app; Primary Tags now group hosts.
The general documentation roundup (entry of 22 September 2026) contains only a one-line headline that names dtwiz: it gives no further detail.
Install dtwiz and monitor a host: step by step
Prerequisites
The README asks for two environment variables: DT_ENVIRONMENT (your environment URL) and DT_PLATFORM_TOKEN (a platform token, prefix dt0s16.). It recommends generating that token from the QuickStart app of your tenant, the tested path that creates the needed scopes. If you create it by hand, the README gives a list of scopes (data acquisition, extensions, fleet management, OpenPipeline, settings, storage…) that it calls a practical baseline, not always entirely required. A Classic token (dt0c01.) is only used if you pass --access-token explicitly.
Step 1 — Install and launch
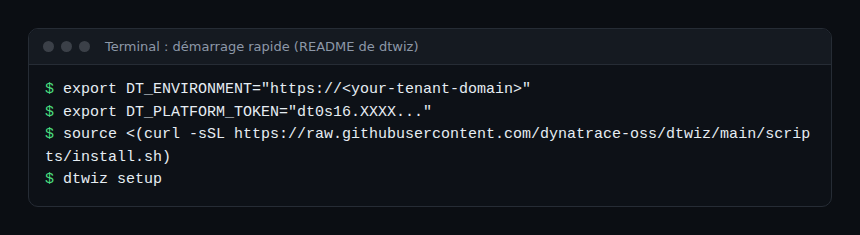
Commands from the README for Linux and macOS (bash or zsh):
export DT_ENVIRONMENT="https://<your-tenant-domain>"
export DT_PLATFORM_TOKEN="dt0s16.XXXX..."
source <(curl -sSL https://raw.githubusercontent.com/dynatrace-oss/dtwiz/main/scripts/install.sh)
dtwiz setup
The first line exports the tenant address, the second the token, the third downloads and runs the install script in the current shell (source makes dtwiz available without opening another terminal), and the fourth starts the interactive flow. Read the script before running it: that rule holds for any curl | source. On Windows, the README gives the PowerShell variant with install.ps1.
Step 2 — Analyse, recommend, install
If you prefer to split it up, the README describes the same sequence as separate commands:
dtwiz analyze
dtwiz recommend
dtwiz install kubernetes
dtwiz status
For a host, the target is dtwiz install oneagent (OneAgent on this machine) or dtwiz install otel-collector (the Dynatrace OpenTelemetry Collector only). The 1.347 note ties host onboarding to the OpenTelemetry collector installation; the note does not name the exact subcommand that triggers this preparation, so check the behaviour in the dtwiz setup wizard. Two useful options: --yes (or -y) skips confirmations, and --json on analyze and recommend gives structured output for a script.
Step 3 — Watch the data arrive
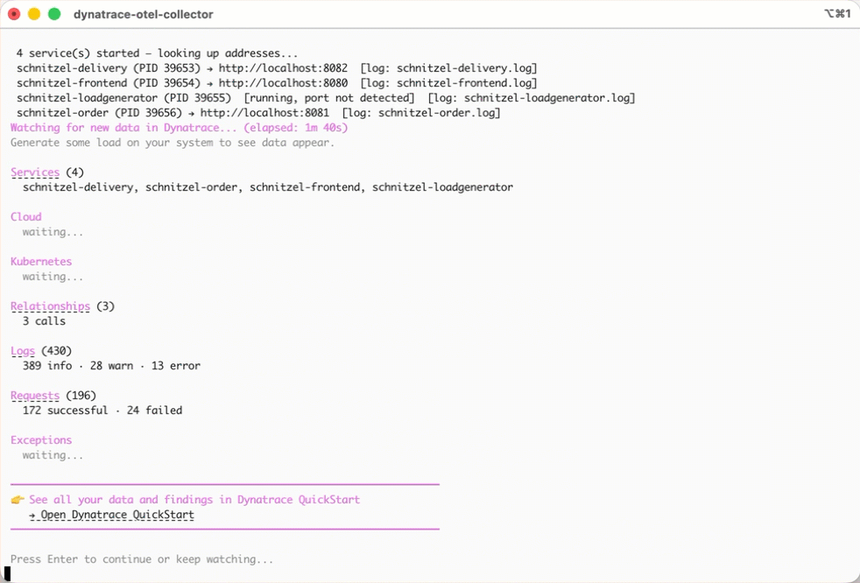
dtwiz watch live-watches the data arriving in Dynatrace (services, logs, traces…). The README image below comes from a demonstration of the Schnitzel application instrumented by dtwiz: it lists the services, relationships, logs and requests detected.
How to check that it works
- In the terminal,
dtwiz statusshows the connection and system state;dtwiz watchshows the data received. - In Dynatrace, open Infrastructure & Operations, Compute menu: the host should appear there within minutes, according to the 1.347 note.
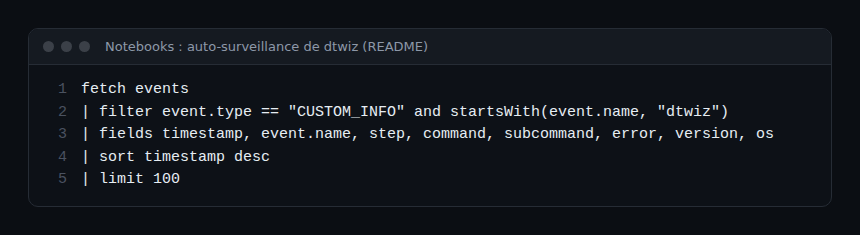
- Query dtwiz self-monitoring in Notebooks or Dashboards. Query given by the README:
fetch events
| filter event.type == "CUSTOM_INFO" and startsWith(event.name, "dtwiz")
| fields timestamp, event.name, step, command, subcommand, error, version, os
| sort timestamp desc
| limit 100
The step field takes the values invoked, install, completed, failed or cancelled, and error a category such as auth_error or dependency_missing, which helps diagnose a failure without rereading the whole terminal.
OneAgent or OpenTelemetry for a host?
With general availability, both methods have a place on the same screen. OneAgent is covered by the OneAgent on Linux installation documentation (the Managed side in our article) and dtwiz can install it too. The OpenTelemetry option suits you if you already standardise your collectors; for the concepts, see OpenTelemetry end to end with Dynatrace and the OpenTelemetry Collector for Dynatrace.
To place the tool in a complete approach, follow the Dynatrace SaaS training path.
Limits and points to watch
- Actively developed project: reread the README before each use, as the command list evolves.
- The platform token carries broad scopes: keep it for a dedicated account and never paste it in a screenshot or log.
- Each command generates an event in your tenant: allow for it in your ingest budget if you automate.
- The release notes do not say which operating systems the OpenTelemetry host preparation covers; check the documentation for your version.
Best practices
- Test on a disposable machine first, before a whole fleet.
- Use
dtwiz analyze --jsonto document the existing state before installing. - Keep
--yesfor scripts you have reviewed, not for the first run. - After installation, check the hosts in Infrastructure & Operations rather than trusting the terminal alone.
Frequently asked questions
Is dtwiz a product supported by Dynatrace?
The repository sits in the dynatrace-oss organisation and describes itself as in early development, with problems to be reported on GitHub. The QuickStart documentation page mentions it and links to that repository. For a support commitment, check your contract.
Does dtwiz work with Dynatrace Managed?
The sources I read describe a SaaS tenant (environment URL, platform token, QuickStart, Infrastructure & Operations). Nothing there indicates use with Managed.
What does “OpenTelemetry hosts generally available” mean?
According to the 1.347 note, OpenTelemetry host monitoring is generally available and visible in the Compute menu of Infrastructure & Operations, like OneAgent. Primary Tags replace the Datacenter concept for grouping hosts.
Conclusion
dtwiz shortens the road from a bare machine to data in Dynatrace, and version 1.347 links it to QuickStart and to OpenTelemetry hosts. Keep the SRE mindset: check the host in the app, limit the token’s rights and read scripts before running them. Sources: SaaS 1.347 release notes, dynatrace-oss/dtwiz repository (README, LICENSE) and the QuickStart guide, read on 27 October 2026.
span.observer is an independent community blog, not affiliated with Dynatrace LLC. Dynatrace is a trademark of Dynatrace LLC. SaaS features evolve quickly: check their availability in your environment and in the official documentation.