A fleet of 2,000 hosts, a tight observability budget, and the same question at every review: do we really need deep instrumentation everywhere? OneAgent monitoring modes answer that question host by host. Full-Stack, Infrastructure and Discovery do not collect the same data, do not inject into processes in the same way and do not consume licence in the same way. This article answers the classic Dynatrace Full-Stack monitoring vs Infrastructure question first, then covers Discovery and Lambda.
The choice has a direct effect on reliability. A critical service monitored in Infrastructure mode has no Distributed traces: on the day of the incident, the on-call engineer sees a saturated CPU but not the slow request behind it, and MTTR grows. Conversely, Full-Stack everywhere is expensive for servers where you only care about health.
This article compares the three modes, shows how to enable them (installation, oneagentctl, UI, Settings API), then covers the special case of serverless functions: OneAgent for AWS Lambda, shipped as a Lambda layer. The content applies to Dynatrace SaaS and Dynatrace Managed, with differences flagged along the way.
OneAgent monitoring modes at a glance: Dynatrace Full-Stack monitoring vs Infrastructure vs Discovery
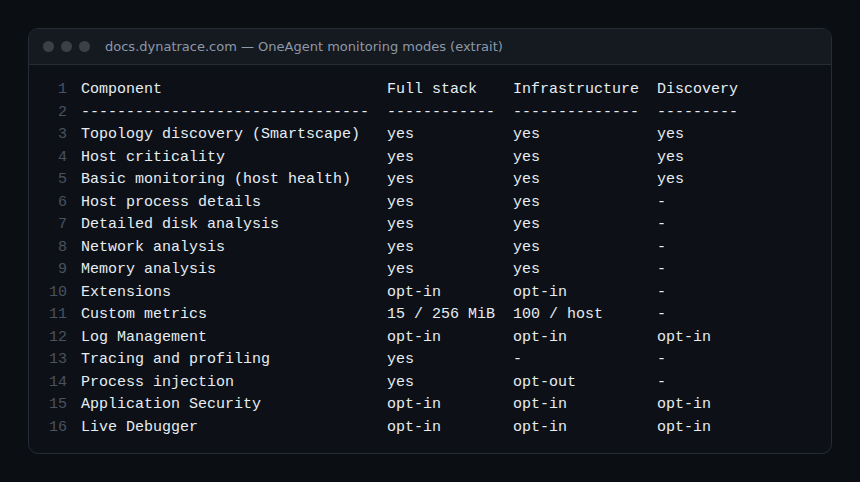
By default, OneAgent installs in Full-Stack mode. The two other modes are lighter and focus on infrastructure. The table below reproduces the matrix published in the official documentation.
Full-Stack: traces, profiling and code
Full-Stack mode gives the complete application view: Distributed traces, profiling, code-level visibility, process details, disk, network and memory analysis. It is the only mode that provides tracing. For custom metrics, the documentation matrix states “15 / 256 MiB”, against “100 / host” in Infrastructure mode.
Infrastructure: host health and backing services
Infrastructure mode keeps Smartscape topology, process details, disk, network and memory, but no tracing. Since OneAgent 1.213 it still injects automatically into processes to collect JMX/PMI metrics and runtime metrics for Java, .NET, Node.js, Go, PHP and web servers (Apache HTTP, NGINX, IIS). This injection is on by default and can be turned off (opt-out). It suits databases, message queues and servers whose health matters more than their code.
Discovery: low-cost coverage
Discovery mode, available from OneAgent 1.281, provides basic metrics to discover hosts and processes: CPU (builtin:host.cpu.usage), memory (builtin:host.mem.usage), disk, network interfaces and host availability. It gives no process details and no extensions. It is only offered with the Dynatrace Platform Subscription (DPS) licensing model and consumes the Foundation & Discovery capability. The documentation recommends Full-Stack for business-critical applications, Infrastructure for critical infrastructure, and Discovery for the rest of the estate.
Choosing the right OneAgent monitoring mode for each host
Start from your SLOs, not from the inventory. Ask three questions per host group:
- Does an SLO depend on a transaction that goes through this host? Yes: Full-Stack, because without traces you will not locate the cause of a latency regression.
- Does the host run a backing service (database, Kafka, ActiveMQ)? Infrastructure is often enough, thanks to JMX and runtime metrics.
- Do you only want to know it exists and is healthy? Discovery, if you are on DPS.
Consumption per mode depends on your contract: our article on DPS licensing and consumption helps you cost the scenario before switching hundreds of hosts.
In practice: changing the mode
Step 1 — Set a default mode
Before installing, you can change the mode offered by default on the deployment page (Linux, Windows, AIX). In the latest platform: Settings > Fleet management > Default mode. In Dynatrace Classic (and therefore Managed): Settings > General > Versions and updates > OneAgent default mode.
Step 2 — Choose the mode at installation
The --set-monitoring-mode installation parameter accepts fullstack, infra-only or discovery:
# Linux installation in Infrastructure mode
sudo /bin/sh Dynatrace-OneAgent-Linux.sh --set-monitoring-mode=infra-only
Linux installation is covered in detail in our OneAgent Linux guide, and for SaaS in module 2 of the SaaS course.
Step 3 — Switch an existing host with oneagentctl
The tool lives in /opt/dynatrace/oneagent/agent/tools by default and requires root privileges:
cd /opt/dynatrace/oneagent/agent/tools
# read the current mode: fullstack, infra-only or discovery
sudo ./oneagentctl --get-monitoring-mode
# switch to Discovery and restart OneAgent
sudo ./oneagentctl --set-monitoring-mode=discovery --restart-service
Changing the mode requires a restart of OneAgent (--restart-service, version 1.189+) and of the monitored services. An injected module stays linked to the process until that process restarts: schedule the switch in a maintenance window.
Step 4 — Use the UI or the API
In the UI: Hosts Classic, host page, More (…) > Settings > Host monitoring > Monitoring Mode. At scale, use the Settings API with the builtin:host.monitoring schema: fetch the schema, then create the configuration object per host.
Step 5 — Manage injection
In Infrastructure mode, injection can be turned off per host (--set-auto-injection-enabled=false) or through process monitoring rules. The documentation advises against it: without injection, Application Security and Live Debugger no longer detect anything. Discovery mode is the opposite: code-module injection is off by default and can be turned on per host (Advanced settings > CodeModule Injection) if you want Application Security.
OneAgent for AWS Lambda
A Lambda function has no host to install an agent on. Dynatrace therefore ships OneAgent as a public Lambda layer per runtime and region, configured through environment variables or a dtconfig.json file. Supported runtimes for tracing are Python, Node.js, Java, .NET and Go. Full-Stack or Infrastructure modes do not apply here: the layer traces invocations.
What the layer brings
- Distributed traces across API Gateway, SQS, SNS, EventBridge, Application Load Balancer and calls through the AWS SDK;
- cold start detection, filterable in requests (Function cold start);
- log collection through the Lambda Telemetry API, without going through CloudWatch.
Deploying the layer
- In Dynatrace Hub, select AWS Lambda, then Set up.
- Choose the runtime, architecture, region and method: environment variables, JSON, Terraform, AWS SAM, Serverless Framework or CloudFormation.
- Add the layer by its ARN (Dynatrace account
585768157899for the current generation) and the variables provided by the wizard.
With the AWS CLI, be careful: --environment replaces all the function’s variables. Include the existing variables in the same command:
aws lambda update-function-configuration \
  --function-name order-api \
  --layers <layer-ARN-from-the-wizard> \
  --environment "Variables={AWS_LAMBDA_EXEC_WRAPPER=/opt/dynatrace,DT_TENANT=<tenant>,DT_CLUSTER=<cluster>,DT_CONNECTION_BASE_URL=<url>,DT_CONNECTION_AUTH_TOKEN_SECRETS_MANAGER_ARN=<secret-arn>}"
The DT_CONNECTION_AUTH_TOKEN_SECRETS_MANAGER_ARN variable (OneAgent 1.295+) reads the token from AWS Secrets Manager instead of storing it in clear text. The function needs the secretsmanager:GetSecretValue permission on that secret, and the secret must contain the token alone, not JSON.
Costs and limits to know
- Cold start: about 900 ms for Node.js, 1,000 ms for Python, 1,500 ms for Java, 600 ms for Go and 5,000 ms for .NET, measured on hello-world functions with 512 MB. Response time typically increases by less than 10%.
- Local configuration only: the layer ignores settings defined on the server side; only variables and
dtconfig.jsoncount. - Lambda Managed Instances is not supported.
- On Java 25, the AOT cache enabled by default prevents injection:
JAVA_TOOL_OPTIONS="-XX:AOTCache=none"(OneAgent 1.343+), at the cost of a longer cold start. - On Node.js, ESM is opt-in via
DT_ENABLE_ESM_LOADERS=true. - Managed: the Managed documentation describes the same integration, but Managed offline clusters are not supported.
If your functions still use the classic layers (account 725887861453), migrate: the documentation shows a typical Java cold start going from under 4,000 ms to under 1,500 ms, and a Java minimum memory of 128 MB instead of 1,500 MB. Rename DT_CLUSTER_ID to DT_CLUSTER on the way. For CloudWatch metrics, add the AWS CloudWatch integration.
How to check that it works
- Hosts:
oneagentctl --get-monitoring-modereturns the expected mode; in Deployment Status, OneAgents tab, the Auto-injection filter shows hosts where injection is disabled. - Lambda: invocations produce traces in Distributed Tracing, logs, and the function shows up in Services. To diagnose the export, temporarily add
DT_LOGLEVELCON=infoandDT_DEBUGFLAGS=debugHttpNative=true: aHTTP/1.1 202 Acceptedline confirms the export. A 401 points to the token, tenant or URL; a 404 or a 200 to theDT_CONNECTION_BASE_URL.
Best practices
- Tie each mode to a host group and an SLO, document the rule, and apply it through the Settings API rather than by hand.
- Switch during a maintenance window: processes must restart for the change to be complete.
- For Lambda, store the token in Secrets Manager, measure cold start before and after, and place the ActiveGate in the functions’ region if latency matters.
- Review the choice every quarter: a service that joins a critical journey must move to Full-Stack.
Frequently asked questions
Can I move from Full-Stack to Discovery without reinstalling OneAgent?
Yes, with oneagentctl --set-monitoring-mode=discovery --restart-service, the UI or the Settings API. Plan a restart of the monitored processes to remove modules already injected.
Does Discovery mode exist on Dynatrace Managed?
The Managed documentation describes all three modes, but Discovery is only available with the DPS licensing model. Check your contract before considering it.
Does OneAgent for Lambda have an Infrastructure mode?
No. The Lambda layer traces invocations and can collect logs. Platform metrics (duration, errors, throttles) come from the CloudWatch integration, to be combined with the layer.
Conclusion
OneAgent monitoring modes are not an installation setting you forget: they decide what on-call will see on the day of the incident. Full-Stack where the SLOs live, Infrastructure for backing services, Discovery for coverage, and the Lambda layer for serverless, with an eye on cold start. For details, see the OneAgent monitoring modes documentation and the Trace Lambda functions guide.
span.observer is an independent community blog, not affiliated with Dynatrace LLC. Dynatrace is a trademark of its owner. The examples are provided for guidance only: test them in your own environment before using them in production.