
The Dynatrace Managed MCP server connects an AI assistant (VS Code, Claude, Cursor, Kiro, Gemini CLI…) to one or more self-hosted Dynatrace Managed clusters. The assistant can then list problems, explore entities, read SLOs or search logs, without you pasting screenshots into the conversation.
For an SRE team the need is concrete: during an incident, every round trip between the editor and the console adds to MTTR. And if your organisation migrated to SaaS without moving the history, older data stays in Managed: the repository covers exactly that case, with a Managed server for history and the SaaS server for recent data.
This guide covers what the server can and cannot do, installation, the API token, multi-environment configuration, MCP clients, HTTP mode and security. It applies to Dynatrace Managed only; for SaaS, see our article on the Dynatrace SaaS MCP server.
Dynatrace Managed MCP server: what it does, and what it does not
The dynatrace-oss/dynatrace-managed-mcp project is an open source server (Apache 2.0 licence) published on npm as @dynatrace-oss/dynatrace-managed-mcp-server. It is community-supported: help goes through the repository’s GitHub issues. It turns the assistant’s tool calls into requests to each environment’s Environment API, mostly v2, plus one v1 call for the cluster version.
The tools exposed
| Area | Tools (prefix dynatrace_managed_) |
Endpoint | Scope |
|---|---|---|---|
| Environments | get_environments_info |
/api/v1/config/clusterversion |
DataExport |
| Entities | list_entity_types, get_entity_type_details, discover_entities, get_entity_details, get_entity_relationships |
/api/v2/entityTypes, /api/v2/entities |
entities.read |
| Problems | list_problems, get_problem_details |
/api/v2/problems |
problems.read |
| Security | list_security_problems, get_security_problem_details |
/api/v2/securityProblems |
securityProblems.read |
| Events | list_events, get_event_details |
/api/v2/events |
events.read |
| Logs | query_logs |
/api/v2/logs/search |
logs.read |
| Metrics | list_available_metrics, get_metric_details, query_metrics_data |
/api/v2/metrics, /api/v2/metrics/query |
metrics.read |
| SLO | list_slos, get_slo_details |
/api/v2/slo |
slo.read |
Differences from the SaaS server
Grail and DQL do not exist in Managed: no tool runs a DQL query. Log search uses the classic search API, metrics use selectors and the Metrics API v2. Everything is read-only: the list contains no tool that writes to the environment. If you know the symptom-to-fix workflow with the SaaS server, keep the method, but expect more targeted queries, entity by entity.
Prerequisites
- A Dynatrace Managed cluster reachable from the machine running the server, and the ID of each target environment.
- Node.js and
npx(the minimum version is set in theenginesfield of the repository’spackage.json). - An MCP client. If the protocol is new to you, read our Model Context Protocol guide first.
Installing the server step by step
Step 1: create the API token
In each environment, create an API token with the eight scopes from the table: DataExport, entities.read, events.read, logs.read, metrics.read, problems.read, securityProblems.read and slo.read. A missing scope does not stop the server from starting: only the matching tool fails. For token families and URLs, our Dynatrace Managed API reference explains the difference between cluster tokens and environment tokens.
Step 2: describe the environments
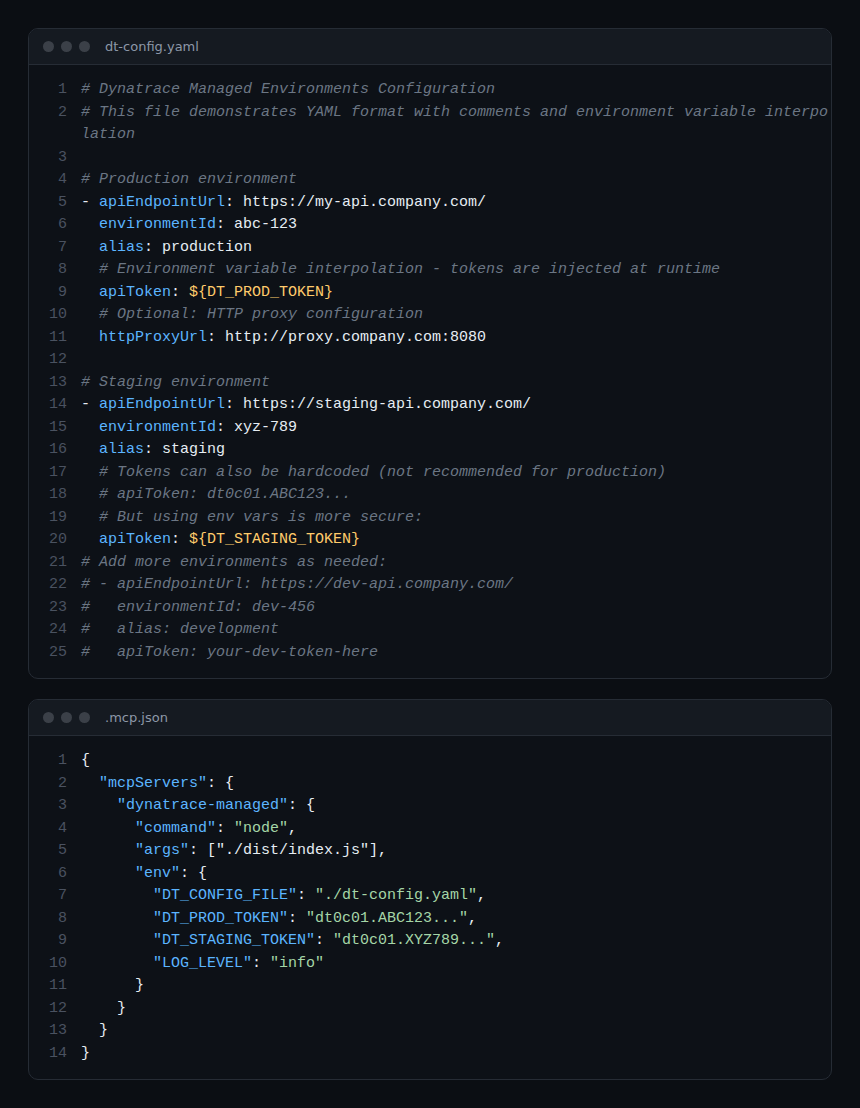
The server reads a list of environments. Each entry has four fields: apiEndpointUrl (cluster base URL), environmentId, alias and apiToken. Example dt-config.yaml with two environments:
# dt-config.yaml
- apiEndpointUrl: https://managed.example.internal/
  environmentId: abc-123
  alias: production
  apiToken: ${DT_PROD_TOKEN}     # injected from an environment variable
- apiEndpointUrl: https://managed.example.internal/
  environmentId: xyz-789
  alias: staging
  apiToken: ${DT_STAGING_TOKEN}
Three critical lines. apiEndpointUrl is the cluster base URL, without /e/<id>/api: the server appends /e/<environmentId> itself, and a doubled path makes every request fail. Aliases must be unique, or the server refuses to start. Finally, a missing ${...} variable also blocks startup instead of passing an empty string. Note: both checks are listed under “Unreleased” in the CHANGELOG. With npm version 1.1.1, a duplicate alias does not block startup yet, and a missing variable is replaced with an empty string.
Then point DT_CONFIG_FILE at this file (relative, absolute or ~ path). In a container, pass the same array as JSON in DT_ENVIRONMENT_CONFIGS instead; if both variables are set, the file wins.
Step 3: declare the server in the MCP client
In local mode (stdio), the client starts the server with npx. The format below works for Claude Desktop, Claude Code’s .mcp.json and Kiro; VS Code uses a servers key instead of mcpServers.
{
  "mcpServers": {
    "dynatrace-managed-mcp": {
      "command": "npx",
      "args": ["-y", "@dynatrace-oss/dynatrace-managed-mcp-server@latest"],
      "env": {
        "DT_CONFIG_FILE": "dt-config.yaml",
        "DT_PROD_TOKEN": "<production-token>",
        "DT_STAGING_TOKEN": "<staging-token>"
      }
    }
  }
}
The repository also offers a Gemini CLI extension and, in its next release (already in the repository, not yet on npm), a Claude Code plugin that asks for the environment configuration at install time. It also ships a dynatrace-managed skill that guides the assistant in choosing the environment and writing entity selectors.
HTTP mode for a team
By default the transport is stdio: one process per workstation. The --http option starts an HTTP service (port 3000 by default, --port to change it, --host for the listening interface). In this mode tokens no longer live in the server configuration: each client sends them in the X-Dynatrace-Tokens header, formatted as alias1=token1;alias2=token2.
npx -y @dynatrace-oss/dynatrace-managed-mcp-server@latest --http --host 127.0.0.1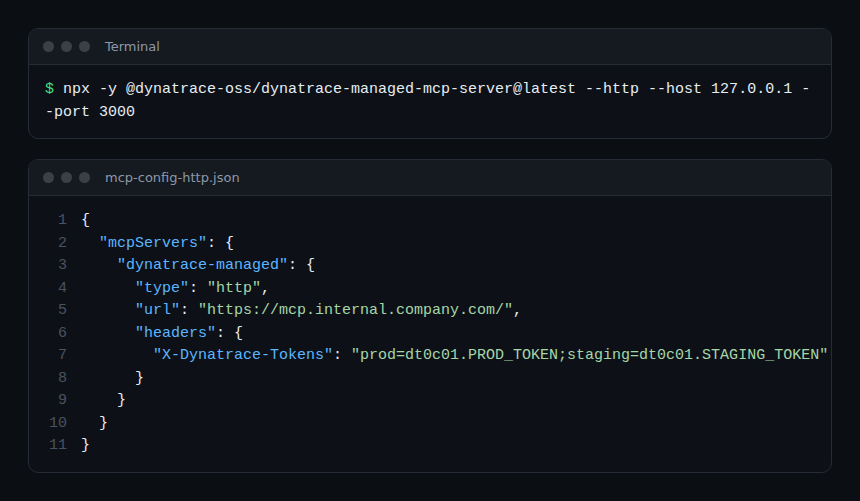
Security: network, proxy and safeguards
- DNS rebinding: in HTTP mode the server always validates the
Host(andOrigin) header. Bound to0.0.0.0, it accepts loopback names only; list the legitimate names inDT_MCP_ALLOWED_HOSTS, which replaces the default list. - Proxy: each environment accepts
httpProxyUrlorhttpsProxyUrl, never both. - Cluster load: a rate limiter allows 20 tool calls per 20-second window by default (
DT_MCP_RATE_LIMIT_MAX_CALLS,DT_MCP_RATE_LIMIT_WINDOW_MS). - Telemetry: disabled by default and enabled with
DT_MCP_ENABLE_TELEMETRY=truefrom the next release; in 1.1.1 it is on by default and turned off withDT_MCP_DISABLE_TELEMETRY=true. - Certificates: the repository documentation describes no dedicated option for internal certificate authorities; test the TLS connection to your cluster before drawing conclusions.
For the general threat model of an MCP server (least privilege, secrets, logging), see securing an MCP server.
How to check it works
- Run the server by hand (
npx @dynatrace-oss/dynatrace-managed-mcp-server@latest): configuration errors show up at startup. - To see logs in VS Code with stdio, set
LOG_OUTPUT=stderr-all; otherwise readdynatrace-managed-mcp.login the working directory. - Ask the assistant to call
get_environments_info: each alias should answer with its cluster version. - Ask for open problems over the last hour on a single alias. An authorisation error almost always points to a missing scope.
Good practices
- One token per environment, limited to the eight read scopes, injected through a variable and never committed to the repository.
- Short time windows (1 to 2 hours) and precise entity selectors: the Managed cluster also serves production.
- Name the environment in the question: 10 problems across 10 environments means 100 answers for the model to read.
- In HTTP mode, listen on
127.0.0.1locally and setDT_MCP_ALLOWED_HOSTSin a container.
Frequently asked questions
Can I use the SaaS MCP server on a Managed cluster?
No. The Managed repository points to the dynatrace-mcp server for SaaS. After a migration, you can declare both servers in the same client: Managed for history, SaaS for the present.
Can the server change my Dynatrace configuration?
The tools listed in the repository are all reads, and the scopes requested are read scopes (plus DataExport). Nothing in the current tooling writes to the environment.
How many environments can I declare in HTTP mode?
The limit comes from the size of the X-Dynatrace-Tokens header: about 140 to 150 environments with the default Node.js limit of 16 KB, fewer behind nginx (8 KB by default). Both limits can be raised.
Conclusion
The Dynatrace Managed MCP server gives an AI assistant read access to the problems, entities, logs, metrics, events and SLOs of your self-hosted clusters, through the Environment API. A configuration file, a token with eight scopes and a few lines in the client are enough. Without DQL, answer quality depends on targeted questions: one alias, a short window, a precise entity. That is also what protects your cluster and your error budget.
Sources: dynatrace-managed-mcp repository and creating an API token (Managed documentation).
span.observer is an independent community blog, not affiliated with Dynatrace LLC. Dynatrace is a trademark of its owner. The server evolves quickly: check options and tools in the official repository before installing it.