
The Dynatrace Managed vs SaaS question comes back with every tender, every contract renewal and every security audit. On one side, a cluster installed in your own data centres, which you size and operate. On the other, a platform hosted by Dynatrace, where Grail, DQL and the new apps land. Both carry the same product name, but they are run in very different ways.
The wrong choice is expensive over time: an ops team spending its weeks updating nodes instead of improving its SLOs, or a regulatory constraint discovered after signing. This guide compares the two models on concrete criteria (data, network, operations, features) and proposes a five-step decision process.
It is written for architects, operations leads and SREs who have to decide or revisit an existing choice. It covers both worlds: Dynatrace Managed (on-premises) and Dynatrace SaaS. Commercial terms depend on your contract and are not covered here.
Two deployment models, one product family
Dynatrace Managed is a cluster you install on your own servers. The installer deploys on every node the Dynatrace Server, Apache Cassandra, Elasticsearch, NGINX and an embedded ActiveGate. Each cluster has its own Cluster Management Console (CMC) to manage nodes, environments, users and licences. Details are in the Dynatrace Managed architecture.
The cluster is not cut off from the world: it sends self-monitoring and licence data to Mission Control, the Dynatrace team that provides updates and proactive support. With your permission, that team can access the cluster remotely to help with updates and troubleshooting.
Dynatrace SaaS is hosted and run by Dynatrace. You manage no node, no storage and no server update. You only deploy data collection (OneAgent, ActiveGate, Dynatrace Operator, OpenTelemetry) and configure the environment.
Dynatrace Managed vs SaaS: criterion by criterion
| Criterion | Dynatrace Managed | Dynatrace SaaS |
|---|---|---|
| Hosting | Your servers, your data centre | Infrastructure run by Dynatrace |
| Platform operations | Your job: nodes, disks, backups, certificates | Handled by Dynatrace |
| Server updates | Delivered by Mission Control, mandatory, typically every four weeks; you choose the slot | Applied by Dynatrace |
| Storage and queries | Cassandra and Elasticsearch; metric selector (builtin:), Data Explorer |
Grail; DQL queries on logs, metrics, traces, events |
| New features | Delivered when they do not depend on Grail | All of them, including those built on Grail |
| Network | Port 443 internally; Cluster ActiveGate for external traffic | Outbound HTTPS from agents or ActiveGate to Dynatrace |
| High availability | Premium High Availability across two data centres | Handled by the platform operator |
| Typical size | Clusters of 3, 12, up to 30 nodes according to the documentation | Not your concern |
The most decisive point is Grail. The page Unavailable in Dynatrace Managed explains that Grail is built as a massively parallel data lakehouse, designed for thousands of nodes, and that the Managed roadmap does not plan to support it. Dynatrace also confirms there that it keeps shipping monthly updates for Managed, with the innovations that do not need Grail.
What it changes day to day
On Managed, a query on host CPU usage goes through the Metrics API v2 and the metric selector:
# Dynatrace Managed — token with the metrics.read scope
curl -s -H "Authorization: Api-Token {token}" \
  "https://{your-domain}/e/{environment-id}/api/v2/metrics/query?metricSelector=builtin:host.cpu.usage&resolution=1h"
On SaaS, the same question is written in DQL in a Notebook or a Dashboard:
timeseries usage = avg(dt.host.cpu.usage), by: dt.entity.hostKeys differ (builtin:host.cpu.usage on one side, dt.host.cpu.usage on the other), and so do the tools. Your runbooks, dashboards and alerts do not carry over as they are. The Dynatrace Managed metrics path and its SaaS counterpart show the gap metric by metric.
Network and data residency
A Managed cluster with no extra configuration is reachable internally only and exposes port 443 for the REST API, OneAgent traffic and the web UI. To receive external traffic (agents outside the network, RUM, Synthetic), the documentation advises against exposing the cluster directly and recommends Cluster ActiveGates in front.
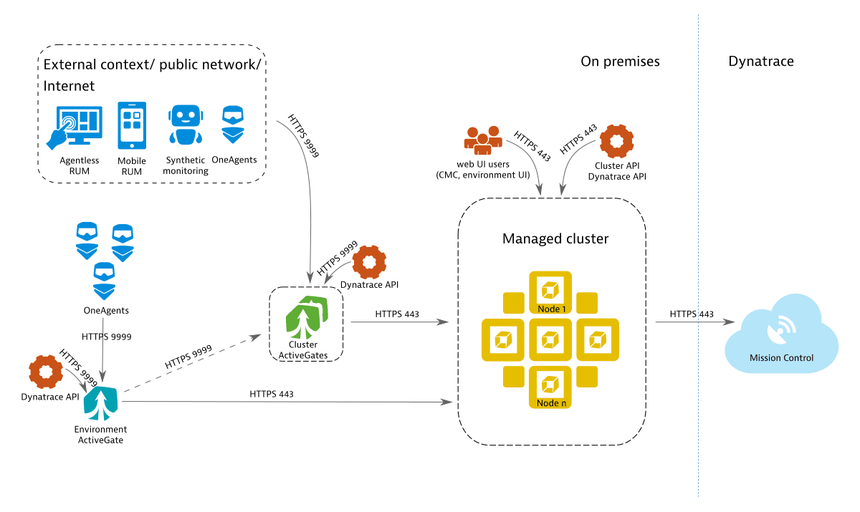
Monitoring data stays with you. What goes to Mission Control (self-monitoring, licensing) is described on the Mission Control data exchange page, and you keep control of the privacy settings. For fully isolated sites there is an offline mode, covered in Dynatrace Managed in offline mode.
If Mission Control becomes unreachable, behaviour depends on the licence model: with classic licensing, after more than 14 days of outage the cluster refuses overages, without stopping monitoring within the quota; with Dynatrace Platform Subscription, usage is collected and sent once the connection is back.
A five-step decision process
Step 1 — List the non-negotiable constraints
Regulation, customer contracts, security policy: write down what forbids (or not) sending telemetry outside your walls. The Dynatrace documentation gives Managed customers the same advice: define the blockers precisely, application by application.
Step 2 — Split by scope
Not every application has the same requirements. Sort them: those that can move to SaaS now, those that must stay on-premises, those to revisit later. The documentation mentions a temporary hybrid SaaS + Managed deployment as an option.
Step 3 — Measure the operational cost
Count the time actually spent on the cluster: updates every four weeks, disks, backups, certificates, capacity. Compare it with the time spent on your SLOs and automation. That is toil in the SRE sense: repetitive work that does not improve your services’ reliability.
Step 4 — List the features you expect
If your teams want DQL, Notebooks or log analytics on Grail, only SaaS delivers. If the main need is APM, infrastructure and RUM with stable screens, Managed is enough.
Step 5 — Decide and plan
Record the choice with its reasons and a review date. If you move to SaaS, follow the Managed to SaaS migration plan; Dynatrace also offers a questionnaire (Managed to SaaS Readiness Assessment).
How to check that your choice holds
- On Managed: track cluster health and monthly operating time (see monitoring cluster health).
- On SaaS: check that each integration sends data, for example with
fetch logs | limit 10in a Notebook. - In both cases: revisit the decision when a constraint changes (new regulation, new Grail need, hardware end of life).
Best practices
- Base the decision on written constraints, not on team preference.
- Do not compare screenshots: compare use cases (incident, SLO, capacity).
- Keep configuration as code (Monaco or Terraform) whatever you choose: it makes any later change easier.
- State in every internal runbook whether it applies to Managed, SaaS or both.
Frequently asked questions
Will Grail ever come to Managed?
According to the official documentation, the Managed roadmap does not include Grail, which was built specifically for SaaS and massively parallel processing. Do not build a Managed project counting on it.
Can we run Managed and SaaS at the same time?
Yes, the documentation presents a temporary hybrid deployment as an option for migrating in stages. Plan separate tokens, configurations and runbooks for each platform.
Is Managed more secure than SaaS?
Not by nature. Managed keeps data on-premises, but you inherit the cluster’s security (patches, certificates, access). SaaS moves that burden to Dynatrace. The right choice depends on your obligations, not on a general principle.
Conclusion
Dynatrace Managed vs SaaS is not a matter of taste: Managed meets on-premises data obligations at the cost of ongoing operations; SaaS removes those operations and gives access to Grail and DQL. Write down your constraints, split by scope, measure the toil, then decide with a review date.
span.observer is an independent community blog, not affiliated with Dynatrace LLC. Dynatrace is a trademark of Dynatrace LLC. Features, ports and terms change: check them in the official Managed documentation and with Dynatrace.