An Elastic APM anomaly rule compares a service’s latency, throughput or failed transaction rate with what its machine learning models consider normal, then notifies the on-call team. The usual trap is noise: a rule that is too sensitive wakes someone up for a harmless variation, and a rule that is too loose misses the degradation.
This tutorial walks through the APM Anomaly rule step by step, based on the Elastic documentation (version 8.16 and the current page). It explains how the rule decides an anomaly, which settings limit false alerts and how to check the result. The SRE goal: protect the error budget and cut MTTR without piling up useless alerts.
Scope: Elastic Observability, not Dynatrace. To compare with Dynatrace anomaly detection (Davis), see reducing alert noise with Davis.
Elastic APM anomaly rule: how it decides
The rule computes nothing itself. It reads the results of machine learning jobs created per environment. According to the documentation, new APM jobs include four detectors: latency, throughput, failed transaction rate and low transaction count. Detection only applies to “request” or “page-load” transaction types.
Each anomaly gets a score. The general machine learning documentation says scores range from 0 to 100. The APM page gives a single numeric threshold: from 75 upwards, the transaction duration chart shows an annotation. It does not define the exact mapping between score and severity levels, so I give no bounds for warning, minor, major and critical.
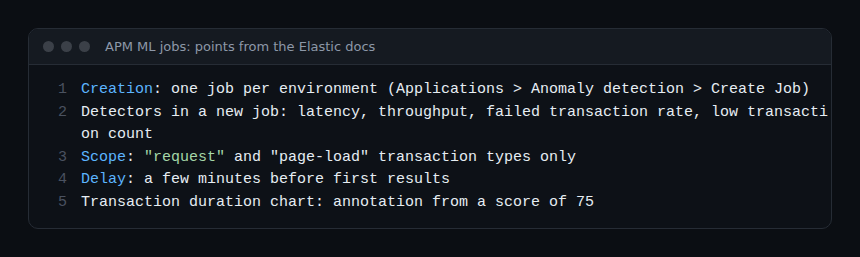
The rule therefore compares the severity of the detected anomaly with the minimum you set. This differs from a fixed threshold: no millisecond value to guess. In return, the model needs data: the documentation says first results appear after a few minutes, and newer services need more traced traffic.
Prerequisites
- APM traces in Elasticsearch (the rule reads the
traces-apm*,apm-*andtraces-*.otel-*indices; they cannot be changed rule by rule). - A suitable licence: the documentation says machine learning requires “an appropriate license”.
- For the Stack version, privileges for machine learning jobs and for the APM application; in Serverless, the Editor role or higher.
- An anomaly detection job created for the target environment.
Create the machine learning job
- Open Applications, then Anomaly detection.
- Select Create Job and choose the environments (for example production).
- Wait a few minutes for the first results.
A new service in an already covered environment needs no new job. An existing job keeps its original detectors: to get low transaction count, the documentation asks you to add the low_count detector or recreate the job.
Create the APM Anomaly rule step by step
The path depends on the version. For Elastic Stack 9.0 to 9.5, the page describes: Alerts, Manage Rules, Create rule, type APM Anomaly. From 9.6, creation goes through the Alerts interface and the Create anomaly rule button on the Applications page. Either way, you can also start from Alerts and rules on an Applications page.
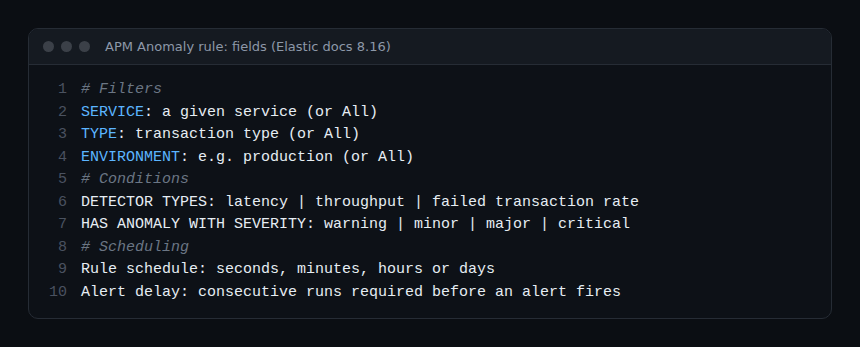
- Filter the scope. Choose Service, Type (transaction type) and Environment, or leave All. One rule per critical service gives more readable alerts than a global rule.
- Choose the detectors. Latency, throughput, failed transaction rate and (current page) low transaction count.
- Set the minimum severity (Has anomaly with severity): warning, minor, major or critical.
- Schedule. Set the check frequency; the 8.16 page accepts seconds, minutes, hours or days.
- Add an action with a connector (email, Slack, webhook, PagerDuty, Jira…), then name the rule.
Reduce noise: the settings that matter
Three documented levers limit false alerts.
- Minimum severity. Start with major to wake someone up, and keep warning for a non-urgent chat notification.
- Alert delay. An advanced option on the 8.16 page: the alert only fires after the given number of consecutive runs. An isolated spike is no longer enough.
- Action frequency. Prefer a summary of alerts at a custom interval over one message per alert. Actions can also be limited by a KQL query (If alert matches query) or by a time window.
Do not enable every detector everywhere. The throughput of a nightly batch service varies by nature; for that one, latency and failure rate are enough. Remember too that low transaction count also flags drops to zero: useful for a service that should receive constant traffic, noisy for an API called once a day.
Write the action with context variables
A useful message contains the service, the environment, the reason and the diagnostic link. The documentation lists the available variables, using Mustache syntax (double braces around the name, for example for context.serviceName).
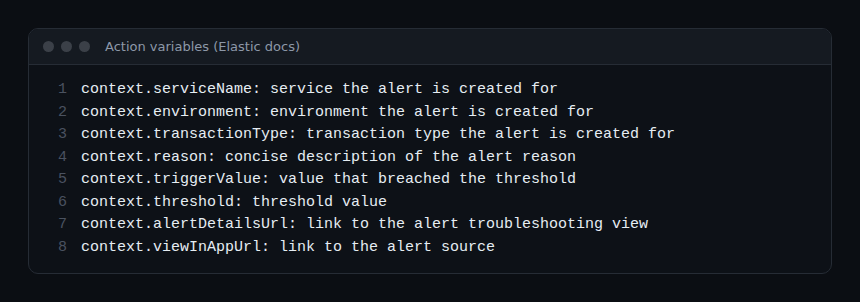
Mind context.alertDetailsUrl: according to the 8.16 page, the variable stays empty if server.publicBaseUrl is not set in Kibana. An alert without an opening link lengthens MTTR: check this setting before sending the rule to production. A connector can be paid or free depending on its type, as the documentation states.
How to check that it works
- In Applications, open the service: the transaction duration chart shows the expected bounds and an annotation from a score of 75.
- On the service map and inventory, a service with an active anomaly is colour-coded (inventory: Stack 9.5 and later, Serverless).
- In Alerts, check that the rule is active and runs at the chosen interval.
- On an alert, open the details page: for an APM Anomaly alert, the documentation describes RED charts, the service map and a severity callout.
Test on a pre-production environment with a low minimum severity, then count after a week how many alerts led to an action. If most need none, raise the severity or add a delay.
Link with OpenTelemetry and Dynatrace
The rule reads the traces-*.otel-* indices: OpenTelemetry traces ingested into Elastic fall within its scope (see the Elastic agent and the OpenTelemetry Collector). For migrating a proprietary agent, see the move to OpenTelemetry, and to link traces and logs, Elastic APM log and trace correlation. On the Dynatrace side, the equivalent relies on Davis; the difference in principle is covered in observability vs monitoring. No integration between this rule and Dynatrace is documented: a webhook is the only simple bridge.
Best practices
- One rule per critical service and environment, with a named owner.
- A high minimum severity for on-call, a low one for information.
- An Alert delay of several runs rather than an alert at the first spike.
- An
alertDetailsUrllink that is always filled in. - After each upgrade, review existing rules: they keep their saved detectors.
Frequently asked questions
Does the APM Anomaly rule need a machine learning job?
Yes. The rule reads job results (.ml-anomalies-* indices): without a job for the environment, it has nothing to evaluate.
What is the difference with a latency threshold?
A fixed threshold compares a value with a number you choose. The APM Anomaly rule compares with a learned behaviour. It adapts to the service’s cycles, but needs data and does not say why the value changed.
Do existing rules get the new detectors?
No. According to the documentation, they keep their saved selections: edit them to add low transaction count, after checking that the job contains low_count.
Conclusion
The APM Anomaly rule replaces guessed thresholds with a learned model. The result rests on three settings: one job per environment, a minimum severity consistent with on-call, and an alert delay. Check the whole chain, from score to alert link, before trusting it with a critical service.
Sources
- Create an APM anomaly rule, Elastic documentation (accessed 30 October 2026)
- APM anomaly rule, Elastic documentation 8.16
- APM machine learning, Elastic documentation
span.observer is an independent blog, not affiliated with Dynatrace LLC or Elastic N.V. Product names belong to their respective owners; values come from the Elastic documentation, so check them for your version.