
You have just joined a team that runs Dynatrace, or you have been asked to evaluate it, and the first question is simple: what is it, and how do you use it? This Dynatrace tutorial for beginners answers both. Dynatrace looks like an APM tool, a log platform, an AI engine and a dashboard host all at once, which makes it confusing when you start from scratch.
This guide sets out the basics without jargon: what the platform does, its building blocks (OneAgent, ActiveGate, Smartscape, Grail, DQL), the difference between Dynatrace SaaS and Dynatrace Managed, then a first hands-on path from a trial environment to your first query. The goal: know where to click and what to look at on day one.
The point of view is an SRE’s: an observability tool is only worth the time it saves during an incident. Each step below is tied to that question: does it reduce time to detect and diagnose (MTTR)?
What Dynatrace is: the short definition
Dynatrace is an observability platform. The official documentation describes it as an AI-powered platform for observability, security and automation. In practice it does three things:
- Collect telemetry: metrics, distributed traces, logs, events, user sessions. Collection goes through OneAgent, OpenTelemetry or cloud and API integrations.
- Connect that data through a dependency map (Smartscape): this process runs on this host, calls this service, which serves this application.
- Analyse and act: anomaly detection, grouping of alerts into Problems with a likely root cause, dashboards, queries, automation workflows.
The difference from a set of separate tools (one for metrics, one for logs, one for traces) is that connection. When latency climbs, you move from the service to the trace, from the trace to the log, from the log to the host, without copying an identifier from one screen to another.
The building blocks to know before you start
| Building block | Role | Where you meet it |
|---|---|---|
| OneAgent | Agent installed once per host; it discovers processes and enables instrumentation automatically | Servers, VMs, Kubernetes nodes |
| ActiveGate | Secure proxy between agents and Dynatrace; also runs API-based monitoring (cloud, Kubernetes, extensions) | Closed networks, cloud integrations |
| Smartscape | Dependency map of hosts, processes, services and applications | Analysis screens, Problems |
| Grail | Unified storage for logs, metrics, traces and events (SaaS only) | Notebooks, Dashboards, queries |
| DQL | Grail’s query language (Dynatrace Query Language) | Notebooks, Dashboards, Workflows |
| Davis / Dynatrace Intelligence | Analysis engine: anomaly detection, root cause, assistant | Problems, Assist panel |
Two definitions from the documentation are worth remembering. OneAgent: a single agent per host collects data for everything running on it, containers included. ActiveGate: a single local exit point towards Dynatrace, which simplifies the network and reduces traffic.
SaaS or Managed: which one will you use?
Before following any tutorial, check which platform you work on, because screens and tools differ.
- Dynatrace SaaS: hosted by Dynatrace. This is where Grail, DQL, Notebooks, the new Dashboards and Workflows live.
- Dynatrace Managed: installed in your own data centre and administered through the Cluster Management Console. The documentation states that Grail is not planned for Managed; you query metrics with the metric selector (
builtin:keys) and Data Explorer.
The choice between them is covered in Dynatrace Managed vs SaaS: which one to choose. For a beginner, the rest of this guide uses SaaS, because it is the only version you can try for free in self-service.
Dynatrace tutorial for beginners: first steps
Step 1 — Pick a trial environment
The Get started page offers two free options from the “Try it free” button on the Dynatrace website:
- Playground: a preconfigured environment with sample data. Nothing to install. Ideal for learning the interface.
- 15-day free trial: your own SaaS environment, into which you send your own data.
Start with Playground if you only want to learn navigation; take the trial if you want to see your own services.
Step 2 — Bring data in with QuickStart
In a trial environment, the QuickStart app opens automatically. The Add data button starts Auto Discovery: you copy a command for your operating system and run it in a terminal. That command installs dtwiz, an open-source CLI (Apache 2.0) that analyses the machine and deploys the most suitable collection method: OneAgent, OpenTelemetry, Kubernetes or cloud.
# Linux / macOS — example values, use the ones QuickStart gives you
export DT_ENVIRONMENT="https://{your-environment-domain}"
export DT_PLATFORM_TOKEN="dt0s16.XXXX"
source <(curl -sSL https://raw.githubusercontent.com/dynatrace-oss/dtwiz/main/scripts/install.sh)
dtwiz setup
The DT_PLATFORM_TOKEN variable expects a platform token (prefix dt0s16). The project README recommends generating it from QuickStart, which grants the right scopes. The project describes itself as in active development: read its README before using it outside a test machine. If you prefer the classic route, install OneAgent directly (see deploying OneAgent and the Operator).
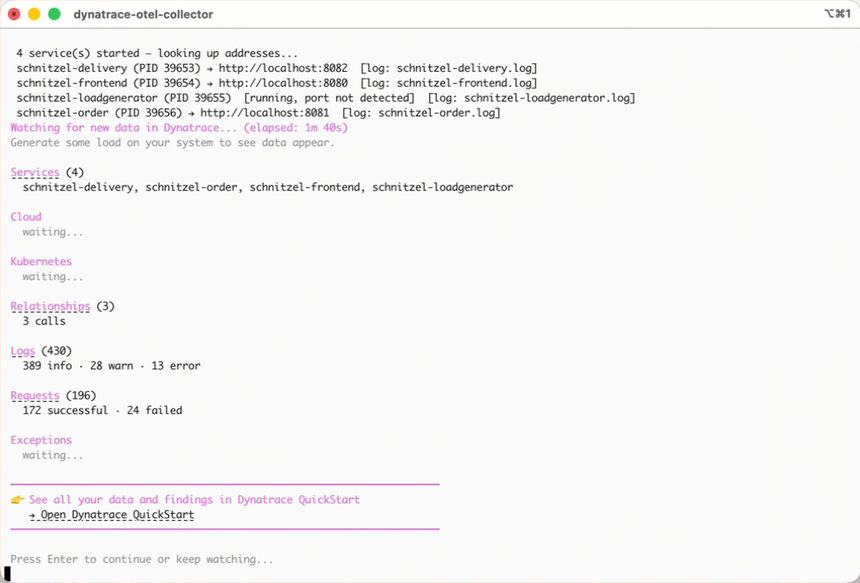
The screenshot above, taken from the dtwiz repository, shows what you should get: the CLI waits for the first data and counts services, logs and requests as they arrive.
Step 3 — Read the findings and Smartscape
Once data arrives, QuickStart shows a map of your environment and a list of findings. The documentation separates two types: issues, active problems to handle first (degraded response time, crashes, database timeouts), and insights, improvement opportunities. Select a service on the map: the throughput, response time and failure rate charts, as well as the findings list, filter on that service.
This is the habit to build: start from a visibly degraded service and drill down to the cause, rather than scrolling through dozens of charts.
Step 4 — Write a first DQL query
Open a Notebook and run a query on logs. Example from the DQL guide in the documentation, counting error logs:
fetch logs
| filter loglevel == "ERROR"
| summarize numErr = count()
Then turn it into a time series to see when errors appear:
fetch logs
| filter loglevel == "SEVERE" or loglevel == "ERROR"
| makeTimeseries count = count(), by:loglevel, interval:5m
To go further, the module DQL fundamentals covers the fetch, filter, summarize and makeTimeseries commands.
Step 5 — Pin what matters on a dashboard
From QuickStart, View dashboard opens a prebuilt dashboard (metrics, health, problems, traces, logs) and Create new dashboard generates one for a service. Add your DQL query to it. Keep few tiles: an on-call dashboard must answer “are we fine?” in ten seconds.
How to check that it works
- In QuickStart, your host or services appear on the map that follows the technology selector.
- In a Notebook,
fetch logs | limit 10returns recent lines. - In the terminal,
dtwizshows growing counters of services, logs and requests.
If nothing shows up after a few minutes, check the environment URL, the token scopes and the machine’s outbound HTTPS access.
Best practices for beginners
- Learn on Playground or a trial, never directly in production.
- Note from the start whether a tutorial targets SaaS or Managed: screen names and queries differ.
- Use example values in your screenshots and notes: no real token, no customer environment name.
- Start with one critical service and a simple SLO rather than instrumenting everything.
- Keep the English feature names (Problems, Notebooks, Dashboards): the documentation and the community use them.
Frequently asked questions
Is Dynatrace free?
No, it is a commercial product. Two free routes exist for learning: Playground, with sample data, and a 15-day trial with your own data. The licensing model is described in the Dynatrace DPS licence.
Do I need to code to use Dynatrace?
Not to get started: OneAgent instruments supported technologies automatically. Learning DQL quickly becomes useful for Notebooks, Dashboards and alerts, and OpenTelemetry for services OneAgent does not cover.
Where should I go after this guide?
Follow a structured path: the Dynatrace SaaS training path or, if your company runs an on-premises cluster, the Dynatrace Managed path. For the core concepts, read observability vs monitoring.
Conclusion
Dynatrace is a platform that collects metrics, traces and logs, connects them through a dependency map and turns them into prioritised problems. For a beginner, the shortest path has five steps: a trial environment, data through QuickStart, reading the findings, a first DQL query and a lean dashboard. The rest is learnt by solving real incidents.
span.observer is an independent community blog, not affiliated with Dynatrace LLC. Dynatrace is a trademark of Dynatrace LLC. Screens, trial offers and tools change: check them in the official documentation.