Sending OTLP to Datadog can be done in more than one way: the official documentation describes four paths with different trade-offs. This article helps an SRE or platform team choose between the DDOT Collector, an upstream OpenTelemetry Collector, OTLP ingestion in the Agent and direct OTLP intake. It does not cover OTLP billing, which we have not verified.
OTLP to Datadog: the four paths to know
According to Datadog’s OpenTelemetry setup page, there are four options:
- DDOT Collector (presented as recommended): Datadog’s distribution of the OpenTelemetry Collector.
- Upstream OpenTelemetry Collector: for teams that already run their own Collector or need advanced processing such as tail sampling.
- OTLP ingest in the Agent: for environments other than Kubernetes on Linux, or minimal configuration without managing Collector pipelines.
- Direct OTLP intake: sending straight to Datadog’s intake with no intermediary component.
These are delivery paths, not competing products. The OTLP protocol is the same; what changes is who receives, processes and forwards the telemetry.
At a glance
- Kubernetes and you want Agent features: DDOT.
- Collector already in place, advanced processing: upstream Collector.
- Non-Kubernetes hosts, little configuration: OTLP in the Agent.
- Serverless, managed platforms, no way to deploy a component: direct intake.
- Available Datadog features depend on the path: read the compatibility table before deciding.
DDOT Collector: the recommended path on Kubernetes
Per the installation page, DDOT is a Datadog build of the OpenTelemetry Collector that runs inside the Datadog Agent as a DaemonSet. It receives OTLP from applications on the same node and forwards it to Datadog. Stated prerequisites: Kubernetes 1.29 or later, Helm 3 and kubectl, and Agent 7.67.0 at minimum if you override the node image tag. The guide covers only the Agent (DaemonSet) pattern; the Gateway pattern has its own guide.
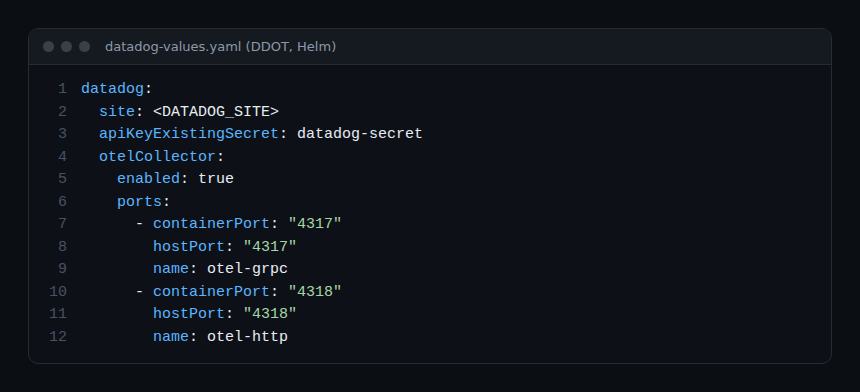
Two caveats from the same page: components beyond the default package go through a custom-components process, and enabling additional Datadog features may incur charges.
Upstream Collector: keep control of the pipelines
If you already run a Collector (see our guide to the OpenTelemetry Collector on Kubernetes), the Upstream OpenTelemetry Collector page shows the current configuration. It uses the otlp_http exporter to https://otlp.${env:DD_SITE} with the dd-api-key header, not the older Datadog Exporter; the datadog extension is only used for Fleet Automation.
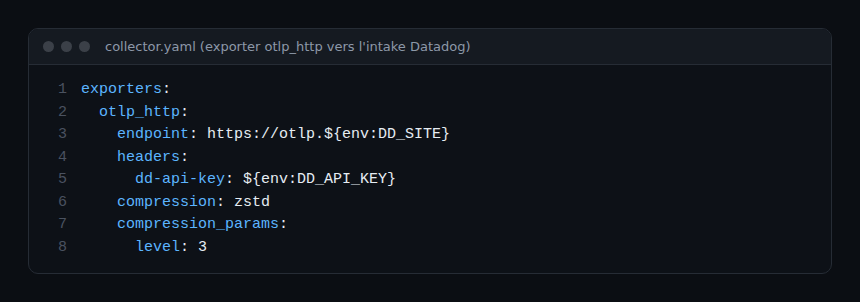
The excerpt above is shortened: the page also includes the dd-otel-metric-config header, a batching send queue, connectors and processors. According to the page, the configurations are tested with Collector Contrib v0.154.0 and require that version or later. Stated limits: no support for serverless or task-based container runtimes (ECS Fargate, EKS Fargate, Lambda), and stateful processing such as tail sampling across several Collectors needs a gateway architecture that routes all spans of a trace to the same Collector. On that point, see our article on OpenTelemetry tail sampling.
OTLP in the Agent: the shortest path for classic hosts
If the Datadog Agent is already installed, the OTLP Ingest in the Agent page explains how to enable an OTLP receiver in datadog.yaml. Ingestion is off by default; once enabled, metrics and traces are on, but logs stay off to prevent unexpected log billing, according to the documentation.
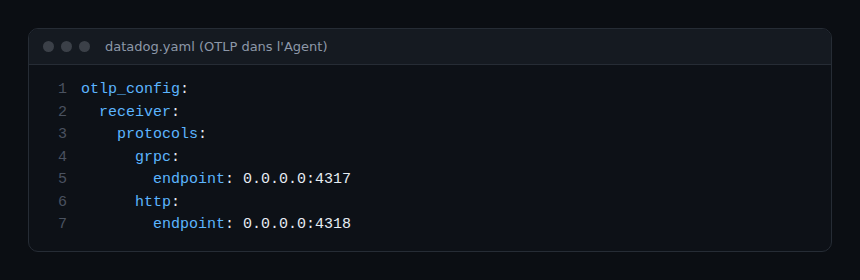
Points to remember from the page:
- Traces and metrics over gRPC or HTTP since Agents 6.32.0 / 7.32.0; logs since 6.48.0 / 7.48.0.
- Default ports: 4317 (gRPC) and 4318 (HTTP). The page uses
0.0.0.0in its examples and notes thatlocalhostis safer for local deployments. - On the application side,
OTEL_EXPORTER_OTLP_ENDPOINTmust point to the Agent, even when the receiver is enabled. - Only a local Agent on each host producing data is supported: sending across hosts is not.
- Data from OpenTelemetry SDKs cannot feed App and API Protection, Continuous Profiler or Ingestion Rules.
Direct intake: when you cannot deploy anything
The Direct OTLP Ingest page exposes the paths /v1/metrics, /v1/logs and /v1/traces. It recommends an Agent or a Collector for production and reserves direct intake for cases where deploying one is not feasible: serverless functions, managed platforms, tight resource constraints.
Maximum request sizes stated: 512 KiB compressed for metrics, 5.1 MiB uncompressed for logs, 15 MiB uncompressed for traces. Above that, Datadog answers HTTP 413; reduce batch size or flush more often. Full hostnames and headers are not on this page: they are in the per-signal pages, which we did not re-read for this article.
Comparing available features by path
The compatibility table compares four combinations: Datadog SDK + DDOT, OTel SDK + DDOT, OTel SDK + upstream Collector, and direct OTLP. Some notable gaps, as read in the table:
- Distributed tracing, correlated logs, Cloud SIEM: supported in all four columns.
- Trace Metrics: with direct OTLP they are “sampled”, computed from spans that reach Datadog and reflecting OTel-side sampling.
- Infrastructure host list and Kubernetes Monitoring: absent with direct OTLP.
- Live Container Monitoring, Universal Service Monitoring, Cloud Network Monitoring: present with DDOT, not with the upstream Collector.
- Continuous Profiler, App and API Protection, RUM: only with the Datadog SDK + DDOT.
Empty cells in the source table list no support value; we do not interpret them.
How to choose: a decision grid
- Where does the workload run? Serverless or managed platform: direct intake (or Datadog’s dedicated pages). Otherwise, next question.
- Do you already have a Collector? Yes, and you want to keep your pipelines, tail sampling or multi-destination output: upstream Collector.
- Are you on Kubernetes? DDOT, if you want Agent features with an OTel pipeline.
- Classic hosts with the Agent already there? OTLP in the Agent.
- Which Datadog features do you need? Check them in the compatibility table before locking in.
The underlying argument for a platform team: the more you stay on standard OTLP and a Collector you control, the more freedom you keep to switch or add a destination. DDOT and the Agent bring Datadog-specific features; that is a deliberate coupling choice, not a flaw. Our OpenTelemetry vs Prometheus comparison and the Dynatrace vs Datadog comparison give more context.
And with Dynatrace?
Dynatrace also accepts OTLP, and a Collector can export to several destinations. We claim no cross integration between DDOT and Dynatrace: it is not documented in the pages read here. If you compare both platforms, starting from vendor-neutral OpenTelemetry instrumentation limits re-instrumentation work.
Frequently asked questions
What is the recommended way to send OTLP to Datadog?
Datadog’s documentation presents the DDOT Collector as recommended, but states that the upstream Collector suits advanced processing, the Agent suits non-Kubernetes Linux environments, and direct intake suits cases with no intermediary component.
Can you send OTLP to Datadog without an Agent or Collector?
Yes, through direct OTLP intake (/v1/metrics, /v1/logs, /v1/traces). Datadog still recommends an Agent or Collector in production and notes request size limits and fewer features (for example no infrastructure host list).
Are OTLP logs enabled by default in the Agent?
No. According to the documentation, log ingestion is disabled by default to prevent unexpected billing; it requires DD_OTLP_CONFIG_LOGS_ENABLED and log collection turned on.
Sources
- OpenTelemetry setup, Datadog documentation
- Install the DDOT Collector, Datadog documentation
- Upstream OpenTelemetry Collector, Datadog documentation
- OTLP Ingest in the Agent, Datadog documentation
- Direct OTLP Ingest, Datadog documentation
- Feature compatibility, Datadog documentation
span.observer is an independent blog, not affiliated with Dynatrace LLC or Datadog Inc. Product names belong to their respective owners. Content based on the Datadog documentation consulted on 30 October 2026; check the current version before any production use.