A Kubernetes rollout succeeds, but hosts never show up in Dynatrace, or some application pods stay without OneAgent. To troubleshoot DynaKube you need a fixed order of work: without one, you read logs at random while monitoring coverage stays incomplete and MTTR grows.
This practical guide follows the approach in the Dynatrace documentation for Dynatrace Operator: the DynaKube status, the troubleshoot subcommand, logs, reading injection annotations, then the support-archive subcommand to prepare a ticket. The plan deliberately differs from the article on connecting the Operator to a Managed cluster: here we start from an installed cluster that misbehaves.
Scope: the pages read are from the Dynatrace SaaS documentation (docs.dynatrace.com/docs). The Managed documentation page carried the same support-archive section when read, but check it for your version.
Prerequisites to troubleshoot DynaKube
kubectlaccess (orocon OpenShift) to thedynatracenamespace, the Operator’s default namespace.- Dynatrace Operator 0.9.0 or later for
troubleshoot, 0.11.0 or later forsupport-archive, according to the documentation. - Permission to create a pod in that namespace, if you want the recommended method for the archive.
Step 1: read the DynaKube and pod state
The documentation sets the first moves: check the DynaKube, run the diagnostic subcommand, look at the pods, then their logs and description.
kubectl get dynakubes -n dynatrace
kubectl -n dynatrace get pods
kubectl logs <pod-name> -n dynatrace
kubectl describe pod <pod-name> -n dynatrace
The number of pods depends on the deployment mode: Operator, OneAgent or CSI driver. A pod in CrashLoopBackOff or Pending is best read with describe first: the events often name the cause (image, resources, volume).
Step 2: run the troubleshoot subcommand
Since version 0.9.0 the Operator ships a subcommand that checks the basic configuration. According to the documentation, it checks that the namespace exists, that the CustomResourceDefinition and the DynaKube exist, that the API URL ends with /api, that the secret has the same name as the DynaKube (or the .spec.tokens value) and holds the Operator and data ingest tokens, that the customPullSecret is defined, that the environment is reachable from the Operator pod with the same parameters (proxy, certificate), and that the OneAgent and ActiveGate image registries are accessible.
kubectl exec deploy/dynatrace-operator -n dynatrace -- dynatrace-operator troubleshootIf your DynaKube has a different name from the default, add the --dynakube <name> argument. The screenshot below reproduces the error-free sample output from the documentation.
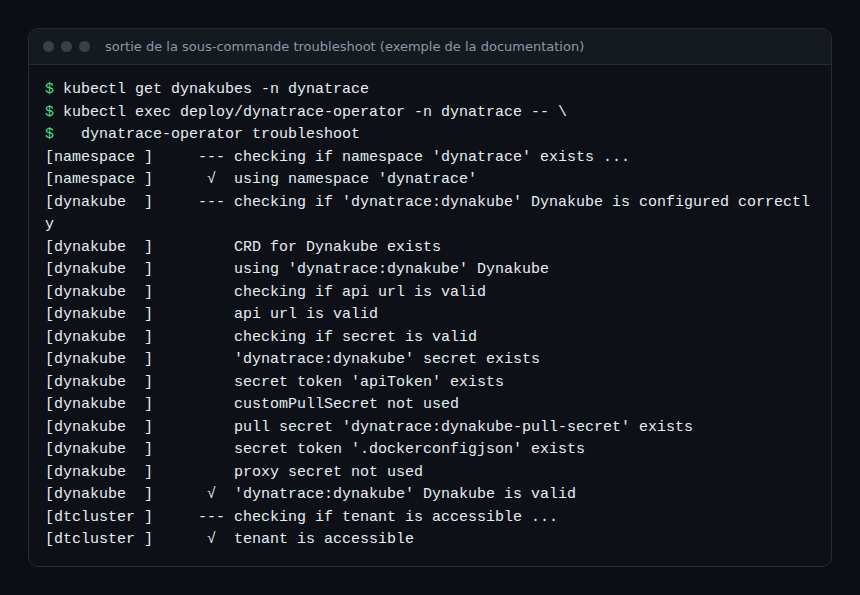
Read the output from top to bottom: the first line marked as failing gives you the lead. A missing token, a malformed API URL or an unreachable tenant is fixed in the DynaKube or its secrets. If the tenant is unreachable while the network looks fine, check the proxy and the certificate: the command takes them into account as the Operator does.
Step 3: read the Operator and OneAgent logs
To follow the Operator live:
kubectl -n dynatrace logs -f deployment/dynatrace-operatorOn OpenShift, the documentation gives the same command with oc. OneAgent pods deployed by the Operator are read with kubectl logs <oneagent-pod> -n dynatrace. On hosts, OneAgent logs are in /var/log/dynatrace/oneagent by default.
A method tip, not a vendor requirement: write down the time of the first symptom and filter the logs from that moment. In a blameless SRE practice, that timeline also feeds the incident review.
Step 4: understand why an injection was skipped
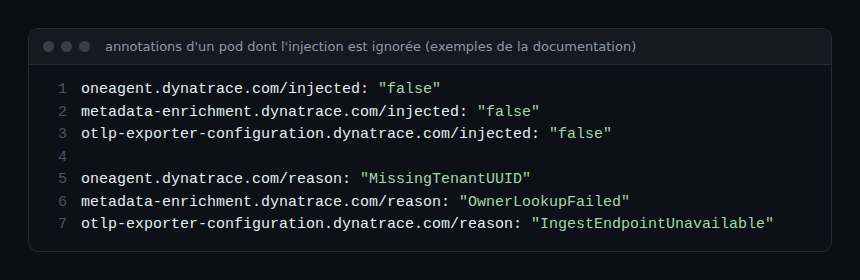
When an application pod is not instrumented, do not start with the Operator logs: read the pod annotations. The documentation states that an injected: "false" annotation exists for OneAgent, for metadata enrichment and for the OTLP exporter configuration, each paired with a reason annotation.
reason value |
Meaning according to the documentation |
|---|---|
NoBootstrapperConfig |
The webhook cannot find or create the bootstrapper config Secret in the pod’s namespace; often, DynaKube reconciliation is not complete. |
NoMutationNeeded |
Injection is disabled, often through annotations. |
OwnerLookupFailed |
The pod owner could not be determined, often because the Kubernetes API was slow or unreachable. |
MissingTenantUUID |
The environment UUID is not verified, usually during initial setup or because of a reconciliation problem. |
DynaKubeStatusNotReady |
The CodeModules status is not ready, so the webhook cannot choose one. |
NoOTLPExporterConfigSecret, NoOTLPExporterActiveGateCertSecret |
The OTLP exporter config Secret is missing, or the ActiveGate certificate Secret is missing (needed only when OTLP export uses TLS to ActiveGate). |
IngestEndpointUnavailable |
No valid ingest endpoint URL could be built. |
These values tie a symptom directly to a cause: several of them go away by themselves once reconciliation finishes, so re-read the DynaKube status before restarting anything.
Special case: ImagePullBackOff on a private registry
Injected pods run a Dynatrace init container that the node must pull. The DynaKube customPullSecret only covers the Operator components in the dynatrace namespace: it is not passed to application pods. According to the documentation, this often appears after moving to Kubernetes 1.35, where the KubeletEnsureSecretPulledImages feature gate is on by default; the fix is to distribute a pull secret to your application namespaces, nodes or pods.
Step 5: produce a support-archive for support
When local diagnosis is not enough, support-archive (Operator 0.11.0 or later) gathers what support needs into one ZIP file. According to the documentation, the archive contains:
kubernetes-version.txtandoperator-version.txt;- a
logsfolder with the logs of all containers of the Operator and of the components deployed in its namespace, including previous containers when available (ActiveGate, OneAgent, webhook, CSI driver, depending on what is deployed); - a
manifestsfolder with the manifests of the components and the DynaKubes; troubleshoot.txt, the output of the step 2 command, run automatically;supportarchive_console.logand, if extensions are enabled, the Extension Controller diagnostic files.
The recommended method runs a standalone pod that reuses the Operator image. The --delay=10 parameter matters: without it, kubectl run misses the first lines of output and can corrupt the archive. The serviceAccountName must be dynatrace-operator so the pod can reach the logs and manifests. The ZIP contents go to standard output, everything else to stderr.
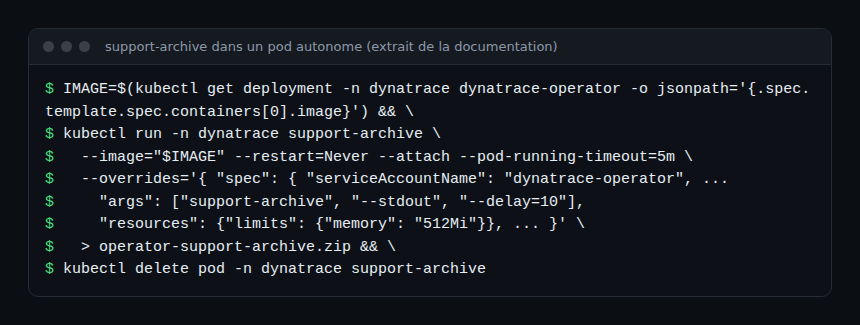
The screenshot is an excerpt: the full command, with its securityContext block, is in the documentation, and that is the one to copy. This method assumes the Operator resources are still installed on the cluster.
If cluster rules forbid that pod, the documentation allows, as a last resort, running the command inside the Operator pod:
kubectl exec -n dynatrace deployment/dynatrace-operator -- dynatrace-operator support-archive --stdout > operator-support-archive.zipOn a large cluster, the volume of collected data can push the Operator past its memory limit and trigger an out-of-memory kill, especially if it is undersized. On Windows, use the cmd.exe command prompt: PowerShell is not supported.
How to check that it works
kubectl get dynakubes -n dynatraceshows the DynaKube without errors, andtroubleshootno longer reports a failure.- The pods in the
dynatracenamespace are ready. - After restarting the affected workloads, the new pods no longer carry an
injected: "false"annotation. - The
operator-support-archive.zipfile opens: an unreadable ZIP almost always points to mixed or truncated output, hence the value of--delay.
Best practices
- Always work in the same order: DynaKube,
troubleshoot, pods, logs, annotations, then archive. A shared checklist reduces MTTR and toil. - Attach
troubleshootoutput and the archive to tickets instead of isolated log excerpts. - Before sending the archive, review the manifests so you do not pass on secrets: the archive contains manifests (check what it holds in your case, the documentation does not detail any masking).
- Keep the Operator up to date: see updating Dynatrace Operator.
- For what comes next, Kubernetes metadata enrichment and deploying OneAgent with the Operator explain the components whose annotations you read here.
Frequently asked questions
Which command should I run first to troubleshoot DynaKube?
kubectl get dynakubes -n dynatrace, then dynatrace-operator troubleshoot in the Operator pod. These are the first two moves in the documentation.
Should I run support-archive inside the Operator pod?
No, the documentation recommends a standalone pod. Running it in the Operator pod is a last resort, with a risk of an out-of-memory kill on a large cluster.
My application pod is not instrumented, where do I look?
In its annotations: oneagent.dynatrace.com/injected and oneagent.dynatrace.com/reason. The reason value points to the cause, for example a DynaKube reconciliation that is not complete.
Conclusion
To troubleshoot DynaKube, keep a short chain: status, troubleshoot, logs, annotations, support-archive. The diagnosis stays on the Kubernetes side; it says nothing about data quality once collected. Sources: the Kubernetes troubleshooting and General troubleshooting documentation pages, read in October 2026.
span.observer is an independent community blog, not affiliated with Dynatrace LLC. Dynatrace is a trademark of Dynatrace LLC. Commands and versions change: check them in the official documentation for your version.