Dynatrace Error Inspector is often described as “the errors tool”, but it only covers part of the subject. According to the documentation, it is a Dynatrace platform app (SaaS, latest generation) for discovering, tracking and investigating front-end errors in web and mobile applications. Service-side errors (HTTP 5xx, exceptions) belong to another mechanism: service failure detection.
Mixing the two leads to endless debates during incidents: “Dynatrace says 2% failures, the browser sees 8%”. Both numbers can be right, because they do not count the same thing. Understanding which error codes are counted, on which side and by which setting, is the condition for an availability SLI that holds up.
This guide clarifies three layers: service failure detection (Managed and SaaS), request errors in RUM Classic with its special codes 970–979 (Managed and SaaS), and the Error Inspector app (SaaS only).
Dynatrace Error Inspector: what the app actually does
Error Inspector is a platform app that requires RUM to be enabled for web and mobile frontends. It has two pages:
- Overview: error counts over time, split by frontend (top 10) or by error type (request error, exception, CSP error), then breakdowns by
error.type,os.name,url.provider(first or third party),browser.nameanddt.rum.user_type(real_user, robot, synthetic) for web,app.short_versionfor mobile. Each chart opens in a Notebook (Edit in Notebook), pins to a dashboard or exports its DQL query (Open With). - Explorer: errors grouped across all frontends, sorted by number of affected users. Filters are kept in the URL, so you can share an analysis with an authorised colleague.
In an error’s details you find the stack trace (readable only if source maps or symbol files have been uploaded, through the API or the classic UI), the Affected pages table, and an Occurrences table that opens the session in Users & Sessions and, where available, the traces in Distributed Tracing. The Send button passes a structured summary to Jira, Microsoft Teams or email through Workflows connectors.
What Error Inspector is not: a back-end service error analysis tool, or a Dynatrace Managed feature.
On the service side: which HTTP codes are errors?
By default, service failure detection counts:
- exceptions (Java, .NET, Node.js, PHP) that abort the service call;
- error pages from web containers for handled exceptions;
- codes 500–599 as server-side errors;
- codes 400–599 as client-side errors.
Why does the client side include 5xx? Perspective: for the server, a 4xx is the client’s fault; for the client, a 5xx is still an error even though it is not its fault. Two special cases are off by default: a missing response code (fire-and-forget call, timeout) and 404, classified as a client-side broken link.
These rules feed the metrics you use in SLOs and alerts. On Managed, for example: builtin:service.errors.server.rate, builtin:service.errors.client.rate, builtin:service.errors.fivexx.count and builtin:service.errors.fourxx.count. Changing detection therefore changes your SLI values: do it knowingly.
In practice: tune failure detection
Step 1 — Choose the level
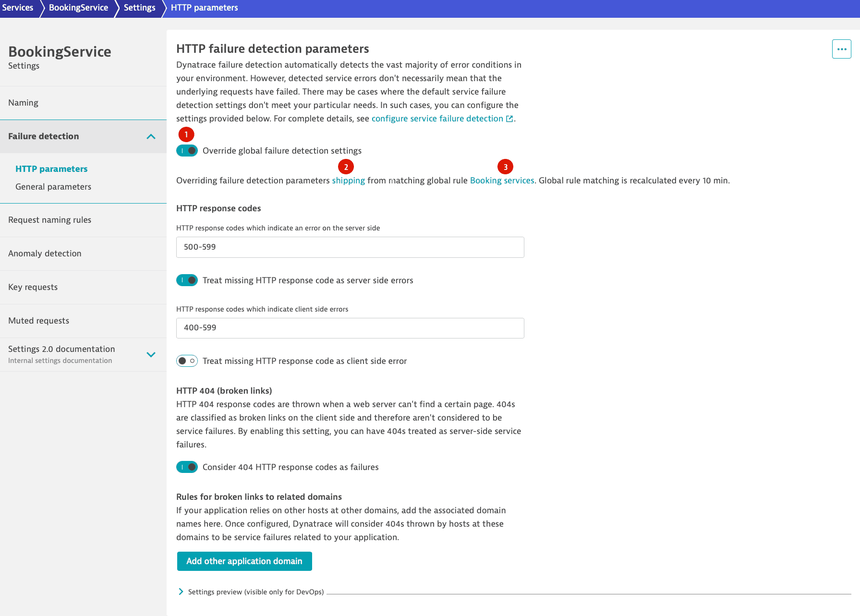
Configuration is global (Settings > Server-side service monitoring > Failure detection rules and Failure detection parameters) or per service. Service-level settings override the global ones. Global rules are evaluated top to bottom, the first match applies, and matching is recalculated every 10 minutes. They do not apply to span services or unified services.
Step 2 — Tune a service
- Open Services, select the service, then More (…) > Settings.
- Go to Failure detection > HTTP parameters (or General parameters for exceptions).
- Turn on Override global failure detection settings, then adjust the code ranges (several ranges separated by commas, for example
400-402, 405-417), the handling of missing codes and the Consider 404 HTTP response codes as failures option.
Step 3 — Handle business exceptions
In General parameters: Success forcing exceptions make the request successful no matter what (client aborting), Ignored exceptions do not mark a failure but let the HTTP code decide, and Custom handled exceptions force a failure for an exception the code handles silently. For a business error with neither exception nor HTTP code, a custom error rule relies on a request attribute.
Step 4 — Version it with the Settings API
Two schemas: builtin:failure-detection.environment.parameters (parameter sets) and builtin:failure-detection.environment.rules (rules assigning them to services), with the settings.read and settings.write scopes. Excerpt of a parameter set:
[{
  "schemaId": "builtin:failure-detection.environment.parameters",
  "scope": "environment",
  "value": {
    "name": "Public API",
    "httpResponseCodes": {
      "serverSideErrors": "500-599",
      "failOnMissingResponseCodeServerSide": false,
      "clientSideErrors": "401-402,405-499",
      "failOnMissingResponseCodeClientSide": false
    },
    "brokenLinks": { "http404NotFoundFailures": false },
    ...
  }
}]
The full body also has an exceptionRules block; start from the documentation example and the schema table rather than writing the object by hand.
On the browser side: request errors and codes 970–979 in RUM Classic
In RUM Classic (Managed, and SaaS for classic applications), there are three error types: request errors, custom errors sent through the RUM JavaScript API, and JavaScript errors. By default, all 4xx and 5xx codes are request errors, as are CSP violations and failed image requests. This is one reason for gaps with service metrics, which only count server-side 5xx.
For applications created from version 1.238 onwards, the RUM JavaScript also reports codes that are not HTTP codes when the real code cannot be captured:
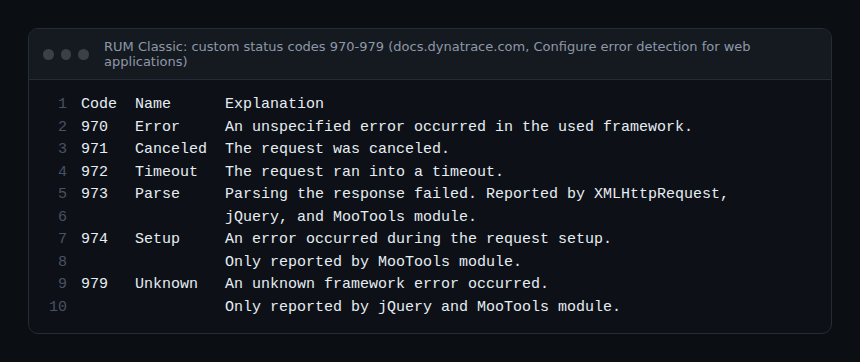
These codes count in Apdex but not in Davis analysis. A 971 on a cancelled ad-tracking call has no impact; a 972 on payment does. To ignore them, disable or delete the HTTP 970-979 rule. Otherwise, a request error rule (Web > application > More (…) > Edit > Errors > Request errors) decides for a code or a range, optionally limited to some URLs, whether to capture the error, include it in Apdex and submit it to Davis. Rules apply in list order.
Best practices
- Base a service’s availability SLI on server-side errors; keep the client side and RUM for user experience.
- Do not turn 404s into failures globally: keep that for services where a 404 truly signals a defect.
- Document each ignored exception with the reason and date; it is less noise, but also one more blind spot.
- Upload source maps with every front-end deployment, otherwise Error Inspector shows unreadable stacks.
How to check it works
- After a detection change, the service’s
builtin:service.errors.server.ratechanges in Data Explorer from the time of the change (global matching is recalculated every 10 minutes). - With a custom error rule, the matching request is marked as failed and Dynatrace states that the rule is the reason.
- On SaaS, the Error Inspector Overview page shows the breakdown by
error.type; open the chart with Edit in Notebook to get the exact DQL query rather than rewriting it.
To link these errors to journeys, see RUM metrics and Core Web Vitals; to go from a service failure to its cause, Distributed traces in Managed; to turn it into an objective, choosing your SLIs. Official references: Error Inspector and Configure service failure detection.
Frequently asked questions
Is Error Inspector available in Dynatrace Managed?
No. It is an app of the latest-generation Dynatrace SaaS platform. On Managed, rely on service failure detection and RUM Classic error configuration.
Why does RUM count more errors than service metrics?
RUM Classic counts all 4xx and 5xx by default, plus CSP violations, failed images and codes 970–979, whereas a service’s server-side error only retains 5xx and exceptions.
Does a 971 code mean an outage?
Not necessarily. It is a RUM JavaScript code (request cancelled), not an HTTP code. Its impact depends on the request: look at the URL before alerting.
Conclusion
Error Inspector answers a precise question: which front-end errors hit the most users, and why. Service and RUM Classic error codes are tuned in failure detection and request error rules. Align the three layers, document every exception, and your availability SLIs will finally say the same thing as your users.
span.observer is an independent community blog, not affiliated with Dynatrace LLC. Dynatrace is a trademark of its owner. Apps, settings and defaults change with the version and platform (SaaS or Managed): check them in the official documentation.