Datadog trace metrics give you request rate, errors and latency for a service without keeping every trace. They are the basis of a RED dashboard (Rate, Errors, Duration) and of reliable alerts. According to the Datadog documentation, they are “calculated based on 100% of the application’s traffic”, whatever the trace ingestion sampling configuration.
That promise has exceptions, especially when OpenTelemetry and sampling are mixed. This guide covers what the documentation says, the list of metrics, and the cases where the figure stops being exact. It is written for SRE and platform teams who want a latency or error SLI that does not depend on how many traces are retained.
Scope: Datadog content, checked against the official documentation consulted on 30 October 2026. span.observer ran no measurements.
Datadog trace metrics: what the documentation guarantees
The “Trace Metrics” page explains that these are APM metrics generated from the traffic of instrumented applications: request counts, error counts and latency. By default the Datadog Agent computes them from the traces the application sends it. You must therefore enable trace collection and instrument the application first. They then feed dashboards and monitors.
They are generated for service entry spans and certain operations, depending on the integration language. The key point is that the calculation comes before the decision to keep a trace. The ingestion mechanisms page confirms it, describing metrics “based on 100% of application traffic”. It also recalls that head-based sampling decides at the root span and propagates the decision: the trace is kept or dropped as a whole.
For an SRE the consequence is simple. You can cut the volume of retained traces, and so the ingestion bill, without distorting the error rate behind an SLO. Traces serve diagnosis, metrics serve steering. This split echoes the difference between observability and monitoring.
The metrics available for RED
Names follow the pattern trace.<SPAN_NAME>.<SUFFIX>. Here is the list from the “Trace Metrics Namespace” page.
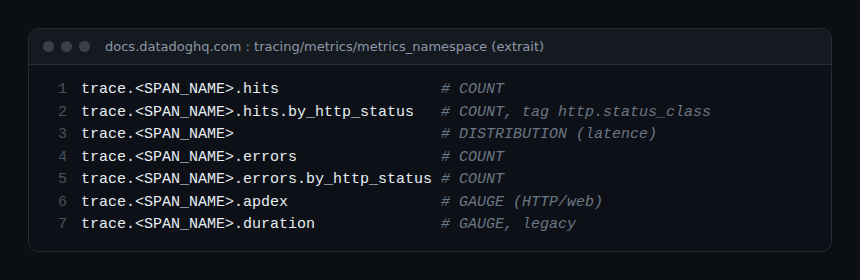
| RED need | Metric | Type (per the docs) |
|---|---|---|
| Rate | trace.<SPAN_NAME>.hits |
COUNT |
| Errors | trace.<SPAN_NAME>.errors |
COUNT |
| Duration | trace.<SPAN_NAME> |
DISTRIBUTION |
| HTTP detail | hits.by_http_status, errors.by_http_status |
COUNT |
| Apdex score | trace.<SPAN_NAME>.apdex |
GAUGE (HTTP or web services) |
For latency, the documentation recommends the distribution, which supports percentiles. The duration metrics are called legacy, kept for compatibility, and do not support percentile aggregations. Available tags include env, service, version, resource, http.status_code and http.status_class. Other span tags are not available on these metrics: to filter on a business attribute you need another approach, such as span-based metrics.
Building a RED view step by step
- Check collection. The application is instrumented and sends traces to the Agent (or the Collector, see below).
- Find the operation name. The
<SPAN_NAME>depends on the integration. Look it up in the Metrics Summary rather than guessing. - Build Rate. Graph
trace.<SPAN_NAME>.hitsgrouped byserviceandenv. - Build Errors. Divide
errorsbyhitsto get a ratio, the basis of an availability SLI. - Build Duration. Use the distribution for percentiles (p95, p99), not the
durationmetrics. - Attach monitors to these series, not to a count of indexed traces.
How to check it works: temporarily lower trace retention in a test environment, then compare hits with the request count seen at the load balancer. If the gap is small while ingestion drops, the documented behaviour holds. If it is large, read the next section.
When the figures stop being exact
The same page lists caveats to know before trusting a RED view.
- Application-side sampling. Some SDKs (the documentation names Ruby) can sample spans before the Agent, which makes the metrics inaccurate. It adds that very few SDKs support this and that it is generally not recommended.
- OpenTelemetry SDK. If the SDK samples, trace metrics are “sampled and potentially inaccurate”.
- AWS X-Ray. Spans are sampled before being sent to Datadog, so the metrics may not reflect all traffic.
- Single span sampling. Single span rules can keep spans that head-based sampling dropped, but cannot drop spans it kept.
In other words, the guarantee holds as long as nothing upstream of the Agent removes spans.
With OpenTelemetry: compute before sampling
If you go through an OpenTelemetry Collector, component order decides accuracy. The Datadog documentation says that, to compute metrics on all traffic while sampling in the Collector, you place the span_metrics connector before sampling processors such as tail_sampling. The README of the Datadog connector (OpenTelemetry Collector contrib repository) says the same for its component: it derives APM statistics from traces and should sit upstream “to ensure that the metrics are computed before sampling”.
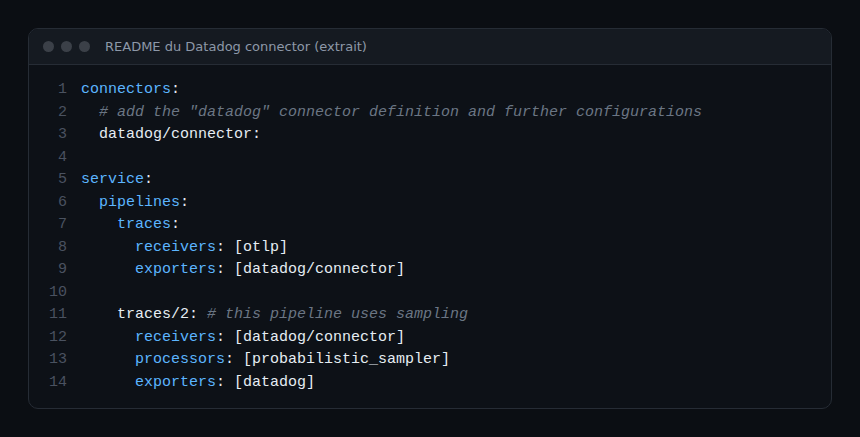
In this excerpt the first pipeline receives OTLP and feeds the connector. The second, the sampling one, then receives traces from the connector. The connector therefore sees the full stream. The same principle applies to any OpenTelemetry chain: see our guides on tail sampling with OpenTelemetry and the OpenTelemetry Collector on Kubernetes. The reasoning (compute metrics before discarding traces) is vendor-neutral; we do not claim a Datadog connector applies as is to Dynatrace.
Best practices
- Base SLOs and alerts on trace metrics, never on the number of retained traces.
- Keep a single place where sampling is decided, and document it.
- Use the latency distribution, not the legacy
durationmetrics. - In a Collector, compute metrics before any sampling processor.
- Regularly check the gap against an independent source (load balancer, gateway).
To place Datadog against other platforms, see the Dynatrace and Datadog comparison.
Frequently asked questions
Are Datadog trace metrics computed on every request?
According to the Datadog documentation, yes: they rely on 100% of traffic, independent of ingestion sampling. The exceptions are SDK-side or X-Ray sampling, which happen before the Agent.
Which metric gives latency percentiles?
The distribution trace.<SPAN_NAME>. The duration metrics are legacy and do not support percentiles.
How do I keep metrics exact with an OpenTelemetry Collector?
Place the connector that computes metrics (span_metrics or the Datadog connector) before sampling processors, as the Datadog documentation and the connector README state.
Conclusion
Datadog trace metrics let you separate steering (RED, SLOs) from trace storage, provided no sampling happens before they are computed. Check your chain from SDK to Agent or Collector, then compare with an independent source. Official references: Trace Metrics, Metrics Namespace, Ingestion Mechanisms and the Datadog connector.
span.observer is an independent blog, not affiliated with Dynatrace LLC or Datadog Inc. Datadog is a trademark of its owner. The information comes from the official documentation consulted on 30 October 2026: check it for your version.