The Elasticsearch frozen tier keeps old data searchable at a lower cost by leaving it in a snapshot repository instead of on local disks. SRE teams that retain logs for months find the promise attractive. The useful question is a precise one: what do you actually pay, and how much latency must you accept?
This article draws on the official Elastic documentation (pages read on 30 October 2026) and on a benchmark Elastic published in January 2025. Vendor figures are attributed as such: span.observer measured nothing. The feature applies to Elasticsearch, not to Dynatrace Managed or Dynatrace SaaS, which have their own storage.
In brief
- The frozen tier holds only partially mounted indices (
partial-prefix), backed by a snapshot. - Searchable snapshots need an Enterprise licence, according to the documentation.
- The saving is on disks and nodes. You pay for it in latency on queries that miss the cache.
- The snapshot repository becomes the only copy of the data, so it must be protected.
Elasticsearch frozen tier: what it is
According to the data tiers page, frozen nodes hold time series data that is rarely read and never updated. It usually arrives from the cold tier and stays until deletion. Elastic recommends dedicated nodes with the data_frozen role.
The searchable snapshots page describes two modes:
- Fully mounted (
restored-): shards are cached in the cluster. The documentation says performance is normally comparable to a regular index. ILM uses it in the hot or cold phase. - Partially mounted (
partial-): a fixed-size local cache keeps only recently searched data. On a cache miss the node reads the repository, so the search is slower. ILM uses it in the frozen phase.
What you really pay for
Cost splits into four items. The first two go down; the other two are easy to forget.
What goes down
- Disks and nodes. Per Elastic, a fully mounted cold tier with no replicas needs half the nodes and disk of a tier with regular indices. Frozen needs even fewer. The data tiers page claims up to 20 times the capacity of the warm tier, according to Elastic.
- Node-to-node copies. Mounts and shard moves copy from the repository, which the documentation generally calls much cheaper than copying between nodes.
What stays or appears
- Object storage. The repository (S3, Google Cloud Storage, Azure Blob Storage, HDFS, a shared file system) holds the data. Its price depends on your provider: check its official price list, as no tariff is quoted here.
- Network egress. The documentation warns that cloud egress fees can be significant. Mount snapshots in a cluster in the same region as the repository; for cross-region search it suggests cross-cluster search or replication.
- The licence. The feature needs an Enterprise licence, per the same page.
Elastic’s benchmark puts a number on the gap using an example. It compares an all-hot 90 TB deployment on Elastic Cloud with one day of hot and the rest in frozen. The price ratio, about 16 times, comes from dividing the article’s two amounts (the currency is not stated). The prices date from when Elastic wrote the post and may have changed: redo the sum with the current price list. Against the dense all-hot option, the gap drops to about 8.6 times, from the same amounts.
The latency to expect
The benchmark, published by Elastic in January 2025, covers 105 TB of logs spanning more than 90 days. The cluster has six nodes on Google Cloud (three hot, three frozen), driven with Rally. Queries imitate Kibana Discover searches on logs; other workloads may behave differently. The post does not state the Elasticsearch version.
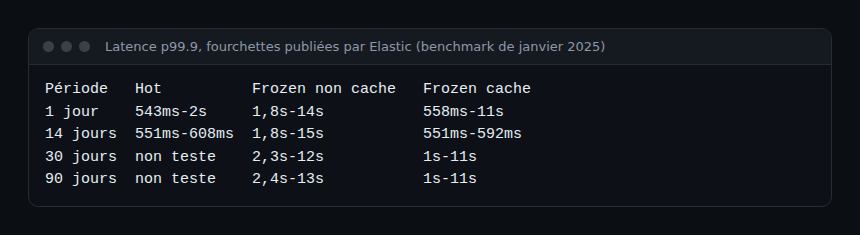
Three readings stand out:
- A query that hits the repository costs several seconds, sometimes far more. For 90 days, Elastic reports a maximum of 5 minutes uncached, against about 1.6 minutes cached.
- Once the cache is warm, frozen gets close to hot on some windows, such as 14 days.
- The cache is cleared when a node restarts, according to the documentation. After maintenance, the first searches will be slow.
For an SRE the consequence is clear: frozen suits after-the-fact incident investigation or audit, not a dashboard refreshed every ten seconds. If a response-time SLO covers these searches, measure it on your own queries.
Set up an ILM policy with a frozen phase
Here is the minimal walkthrough. Prerequisites: an Enterprise licence, data_frozen nodes and a registered snapshot repository (here backing_repo, the name used in the documentation).
- Register the repository, either object storage or a shared file system.
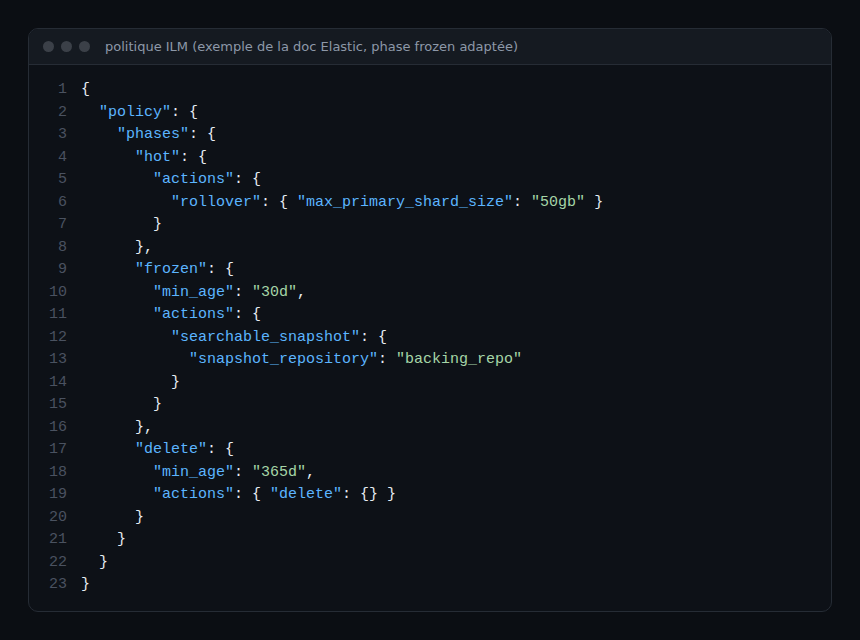
- Create the ILM policy. The
searchable_snapshotaction is allowed in the hot, cold and frozen phases. In frozen it mounts apartial-index. The 30-daymin_ageand the deletion at 365 days below are example values to adapt.
PUT _ilm/policy/logs-frozen
{
  "policy": {
    "phases": {
      "hot": {
        "actions": {
          "rollover": { "max_primary_shard_size": "50gb" }
        }
      },
      "frozen": {
        "min_age": "30d",
        "actions": {
          "searchable_snapshot": {
            "snapshot_repository": "backing_repo"
          }
        }
      },
      "delete": {
        "min_age": "365d",
        "actions": { "delete": {} }
      }
    }
  }
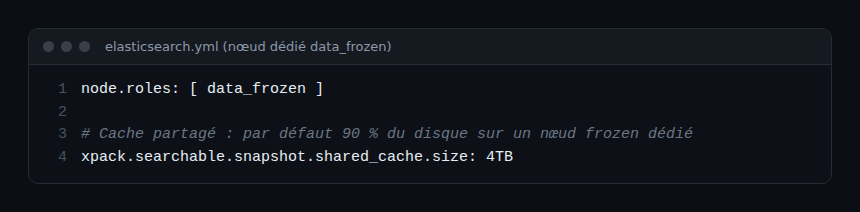
}- Size the cache. On a dedicated frozen node,
xpack.searchable.snapshot.shared_cache.sizedefaults to 90% of the disk, otherwise0b. Per the docs, a 4,000 GB disk gives a 3,900 GB cache and a 400 GB disk a 360 GB cache. Themax_headroomsetting defaults to 100 GB when the size is not set.
Points of attention from the docs
- By default
force_merge_indexistrue: the index is merged to one segment before the snapshot, which cuts repository reads. - The action does not run on a data stream’s write index: plan a
rollover. - The
deleteaction also removes the snapshot by default;delete_searchable_snapshot: falsekeeps it.
How to check that it works
After an index moves, list indices: the name should start with partial- and the index should sit on a frozen node. Then run the same query twice and compare durations: the first fills the cache, the second should be faster. Also watch cluster health: without replicas, losing a node can return partial results during reallocation.
Best practices
- Never delete the snapshot or the repository while indices are mounted from it: it is the only copy.
- Keep the repository and the cluster in the same region.
- Disable allocation before a planned restart to avoid a full re-download.
- Reserve frozen for data you rarely search.
Where OpenTelemetry and Dynatrace fit
The frozen tier solves a retention problem, not a collection problem. If your logs arrive through a collector, see our guide to the OpenTelemetry Collector on Kubernetes and the difference between OpenTelemetry and Prometheus. To place the tool choice, read the Dynatrace and Datadog comparison. No integration between the frozen tier and Dynatrace is documented here.
Frequently asked questions
Is the frozen tier available without an Enterprise licence?
According to the Elastic documentation consulted, searchable snapshots require an Enterprise licence. Check your subscription before designing around it.
What is the difference between cold and frozen?
Cold can use fully mounted indices, with a local copy and no replicas. Frozen uses only partially mounted indices with a limited local cache: less disk, more latency.
Is the “16 times cheaper” figure guaranteed?
No. It is an example priced by Elastic, on Elastic Cloud prices of the time and a specific workload. Redo the sum with your storage provider and your volume.
Conclusion
The frozen tier sharply reduces the hardware needed to keep old logs, at the price of variable latency and a snapshot repository that becomes critical. Test it on your real queries before sending it data that an SLO depends on.
Independent blog, not affiliated with Dynatrace LLC or Elastic N.V. Vendor figures come from Elastic’s documentation and benchmark, not from span.observer measurements.