
The logsdb Elasticsearch index mode stores logs more compactly without changing how you query them. Good news for an SRE team: you enable it in an index template and it applies at the next rollover. New data needs no reindexing.
This tutorial shows how to measure current storage, enable logsdb, force the switch and check the result. Everything comes from Elastic’s documentation, listed at the end. The savings figures are Elastic’s, not span.observer measurements.
At a glance
- logsdb is a value of the
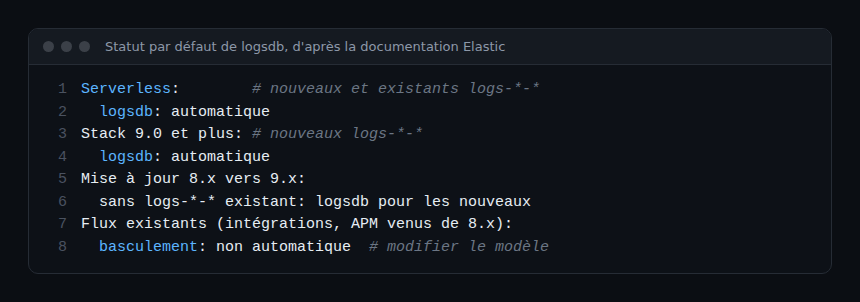
index.modesetting, alongsidestandard,time_seriesandlookup. - According to the documentation, it is applied automatically to new
logs-*-*data streams from Elastic Stack 9.0. Existing streams do not switch on their own. - A template change takes effect at the next rollover: older indices keep their mode.
- Elastic claims savings of “up to” 60 to 65 percent depending on the page. Measure before and after on your own logs.
The problem: logs are expensive to keep
Logs are often the largest volume on an observability platform. Each retention day adds disk, snapshots and restore time. Shrinking that volume lowers the cost per retained day, which platform teams track closely.
The goal here is simple: enable logsdb on an existing stream, confirm it is picked up, then compare index sizes before and after.
What logsdb Elasticsearch does
According to Elastic’s Search Labs post, logsdb combines three techniques:
- smart index sorting, which groups similar data to compress it better;
- advanced compression codecs (Zstandard, delta, run-length), chosen automatically;
- synthetic
_source, which drops the stored_sourcefield and rebuilds it on demand.
The same post gives the default sort (host.name then @timestamp) and says another order may suit your data better. It also warns that logsdb uses more CPU when indexing. The documentation page reports an indexing performance impact of about 10 to 20 percent in its tests.
On licensing, the post says sorting and compression fall under Standard, Gold or Platinum, while synthetic _source needs Enterprise or Serverless. Check your subscription before planning.
Prerequisites and versions
- A self-managed Elasticsearch cluster, Elastic Cloud Hosted or Serverless. The post gives general availability from version 8.17.
- A logs data stream, for example
logs-mesapp-prod(fictional name). - Permission to edit index templates and call the rollover API.
A correction. Some announcements mention logsdb by default on logs-* since 9.2. The official page we read does not name that version: it says “9.0 and later” for new streams. We therefore keep the documentation’s wording.
Enable logsdb without reindexing: step by step
Step 1: measure the size before
Note the size of the stream’s backing indices. The Kibana console lets you list useful cat API columns (the docs.count and pri.store.size columns exist in the API reference):
GET _cat/indices/.ds-logs-mesapp-*?h=index,docs.count,pri.store.size&s=indexCompare indices from similar periods and similar volume, otherwise the measurement means nothing.
Step 2: put index.mode in the template
The documentation says to set index.mode to logsdb in the index template, or in the @custom component template for integration streams. Here is the official example:
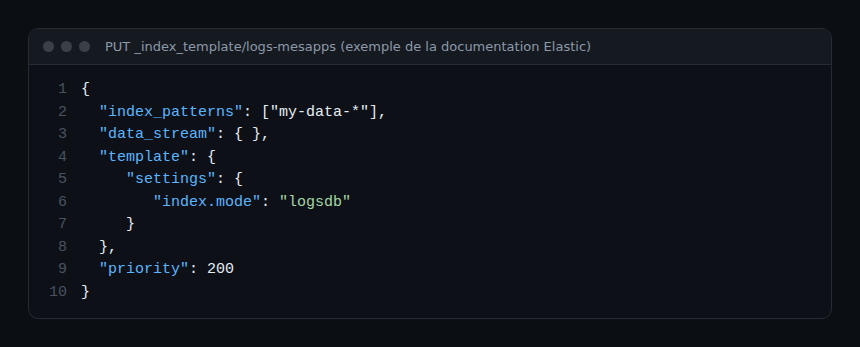
{
  "index_patterns": ["my-data-*"],
  "data_stream": { },
  "template": {
     "settings": {
        "index.mode": "logsdb"
     }
  },
  "priority": 200
}
Warning: the page cautions that a PUT request overwrites the existing template. Retrieve the current configuration first and carry its settings over. In Kibana, the same setting lives under Index Management, Index Templates, Logistics step, Index mode field.
Step 3: force the rollover
The change applies at the next rollover. You can wait for the ILM rule or force the switch:
POST logs-mesapp-prod/_rolloverThe rollover API reference says that for a data stream, rollover creates a new write index, and the new_index parameter is not supported.
Step 4: check
Read the stream with the data stream API. According to its reference, the response contains index_mode at stream level (mode for future backing indices) and for each backing index:
GET _data_stream/logs-mesapp-prod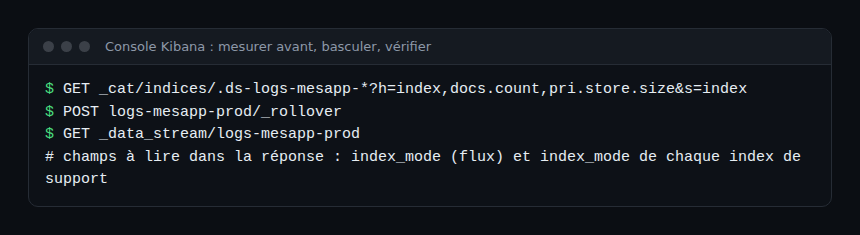
How to check that it works
- The stream reports
logsdbinindex_mode. - The new backing index (created after the rollover) also shows
logsdb; older ones keep their previous mode. - After a few hours of normal ingestion, compare
pri.store.sizeagainst the document count (docs.count) between an old and a recent index. - Replay your usual dashboard and alert queries: results should be identical.
Old data does not shrink: only data written after the rollover benefits. Converting history would need a reindex, which this tutorial deliberately avoids.
Claimed savings: read with care
The logs data stream documentation page reports, in its benchmarks, storage reduced by up to 60 percent, with results varying by data set and version. The Search Labs post cites up to 65 percent against recent versions without logsdb, including up to 30 percent from sorting and a further 20 to 40 percent from synthetic _source. It does not describe the data sets tested. These are vendor ceilings: only your own measurement counts.
Another Elastic post, on petabyte-scale log storage with ILM, covers a hot-frozen architecture. It does not mention logsdb and its costs are the vendor’s illustrative model. We do not reuse its figures. It does offer an ILM policy with one day in hot then frozen, useful for combining logsdb with long retention.
Limits and good practice
- Measure before enabling: keep a snapshot of sizes and indexing throughput.
- Plan for CPU: watch indexing latency after the switch, the trade-off Elastic mentions.
- Do not overwrite a template: read it before the PUT.
- Integrations: use a
@customcomponent template per dataset, as the documentation describes. - Default sort: test it against your queries, the ideal order depends on your fields.
What this changes for an SRE team
At span.observer, we see storage cost push teams to shorten log retention, and so lose context during an incident. Cutting the footprint without touching queries keeps that investigation window, and an index mode can be tested on a single stream before wider rollout.
This setting concerns Elasticsearch storage, not collection. If your logs go through a Collector, the OpenTelemetry format does not change: see our guide to the OpenTelemetry Collector on Kubernetes. For context, reread observability versus monitoring, then the Dynatrace and Datadog comparison or the guide to log ingestion in Dynatrace. We claim no particular integration between logsdb and Dynatrace.
Frequently asked questions
Do I need to reindex to use logsdb?
Not for new data: the documentation says a template change takes effect at the next rollover. Existing indices keep their mode, so history saves no space without a reindex.
Is logsdb enabled by default?
According to the documentation, it is automatic on new logs-*-* streams on Stack 9.0 and later, and on Serverless for new and existing streams. Existing streams on a stack upgraded from 8.x do not switch on their own.
What storage saving should I expect?
Elastic claims up to 60 percent in the documentation and up to 65 percent in a post, based on its benchmarks. These depend on data and version: measure before and after on your indices.
Conclusion
Enabling logsdb takes one template setting and a rollover. Measure size before, check index_mode after, compare equivalent indices, and keep an eye on indexing CPU.
Sources
- Logs data stream, Elastic documentation
- Elasticsearch logsdb index mode, Elastic Search Labs
- Index modules, Elastic documentation
- Get data streams, Elasticsearch API reference
- Roll over to a new index, Elasticsearch API reference
span.observer is an independent blog, not affiliated with Dynatrace LLC or Elastic N.V. Product names belong to their owners; stream names are fictional, and savings figures are those claimed by the vendor.