Dynatrace in Cursor changes one thing above all: the distance between a line of code and what it does in production. A developer edits a service, deploys it, then waits for a signal. That signal lives elsewhere, in another tab, with its own vocabulary. Every trip between the editor and the console lengthens the feedback loop, and that loop, not typing speed, sets a team’s real pace.
On 22 October 2026, Dynatrace announced a verified plugin in the Cursor Marketplace. We do not rework that announcement: this article relies on the documentation of the Dynatrace MCP server and of Cursor. It extends our guide to the Dynatrace plugin for Cursor, which describes what the plugin contains, without repeating its installation. Here we look at the connection mechanics, its guardrails and how to turn it into a team habit.
Scope: the MCP server described here belongs to Dynatrace SaaS. The address contains apps.dynatrace.com. This documentation page does not apply to Dynatrace Managed.
Why shorten the developer feedback loop
Think like an SRE: MTTR depends as much on time to understand as on time to fix. When a service burns its error budget after a deployment, the person who knows the code is not always the one who can read traces. If the editor’s agent can query production, the question “what broke?” is asked in the same place as “where is the bug?”.
The Dynatrace documentation lists what the MCP server can do: generate, explain and run a DQL query, investigate problems and vulnerabilities, analyse Kubernetes events, forecast time series, find documents and troubleshooting guides, and resolve entity names and IDs. It is a read-oriented toolbox, well suited to an investigation from the editor.
Dynatrace in Cursor: connecting to the MCP server
The server is remote and hosted by Dynatrace. The documentation gives its address:
https://{environment-name}.apps.dynatrace.com/platform-reserved/mcp-gateway/v0.1/servers/dynatrace-mcp/mcpEvery request needs a bearer token in the authorization header. The documentation recommends a Platform token, because a token generated from an OAuth client is short-lived. On the Cursor side, the documentation provides .cursor/mcp.json (project) or ~/.cursor/mcp.json (user) files, and ${env:NAME} interpolation in the url and headers fields. The token therefore stays in the environment, not in the file. The public Dynatrace/dynatrace-for-ai repository (Apache 2.0 licence) publishes an mcp.json built that way:
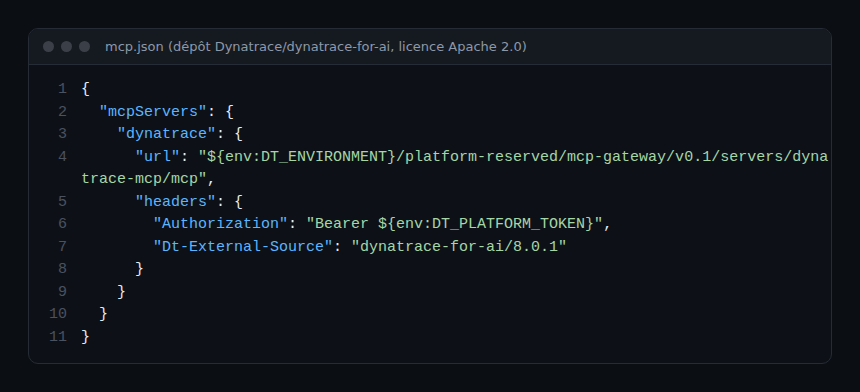
The marketplace plugin packages this connection. The file above helps you understand what happens, or configure Cursor by hand.
In practice: closing the loop in four steps
Step 1 — Set minimal permissions
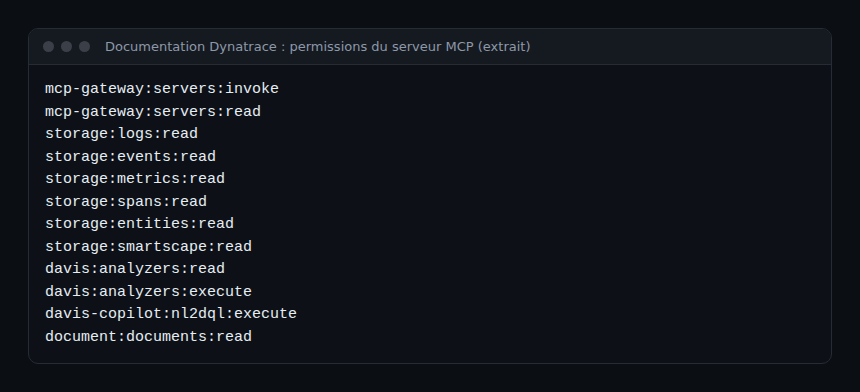
The documentation requires both the user and the token to hold mcp-gateway:servers:invoke and mcp-gateway:servers:read. The permissions of the tools you use come on top, for example storage:logs:read to read logs. The token never acts beyond its user’s rights. Ask only for what the investigation needs.
Step 2 — Set the variables and start Cursor
Before launching the editor, export the two variables read by mcp.json (the Dynatrace documentation uses the same names for its plugin):
export DT_ENVIRONMENT=https://<your-environment-id>.apps.dynatrace.com
export DT_PLATFORM_TOKEN=dt0s16.<your-token>
Create the token under Access Tokens, then Generate new token. One token per person, with an expiry date, remains the rule; see our guide Dynatrace MCP on SaaS.
Step 3 — Check the connection
The Dynatrace documentation checks the setup with VS Code and the prompt “Show me last 10 logs”, and notes that without storage:logs:read no logs appear. In Cursor, enable the server from Customize, then ask the same question. If the server’s tools are listed and an answer comes back, the connection works. An empty answer is not good news: check permissions first.
Step 4 — Investigate, then review the query
Ask progressive questions, from symptom to code. Example written for this article, with a fictional service named checkout:
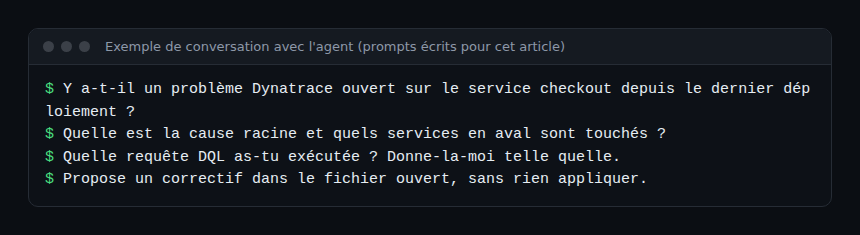
The third question matters most. Replay the query in a Notebook to check scope and time range. A starting point to adapt:
fetch logs, from: now()-1h
| filter loglevel == "ERROR"
| summarize erreurs = count(), by: { dt.entity.host }
| sort erreurs desc
You then know whether the agent’s conclusion rests on data, and you keep a reusable query. This is where the loop closes: production explains, the code changes, the next deployment confirms or refutes.
Keeping control of the agent
By default, Cursor asks for approval before using an MCP tool and shows the call’s arguments. For a read-only investigation, keep that behaviour. Enterprise administrators also have an MCP allowlist: it approves servers by URL and can restrict which tools run automatically. It approves a configuration, it does not distribute it. The Run Mode then decides what runs without confirmation.
These settings add to the skill sets described in our article on Dynatrace for AI, and to the monitoring of the agent itself, covered in supervising a coding agent in the enterprise. Observing what the agent reads in production belongs to the same topic: every query it runs consumes platform resources.
Best practices
- One token per person, minimal read permissions, short expiry, never committed.
- Environment variables in
mcp.json, never the token in clear text. - Keep MCP tool approval on, and an enterprise allowlist.
- Always ask for the DQL query that ran before accepting a conclusion.
- Record the investigation in a Notebook: chat history does not replace it.
Frequently asked questions
Do I need the plugin or a hand-written mcp.json?
Both lead to the same remote server. The plugin bundles the connection and the skills, and can be distributed through a team marketplace. The manual file suits understanding or a special case.
Can I use OAuth instead of a token with Cursor?
The Dynatrace documentation says the server does not support dynamic client registration or public clients, and requires a confidential OAuth client. The Cursor documentation provides an auth block with CLIENT_ID and CLIENT_SECRET. We have not tried it with Dynatrace: the platform token remains the documented, recommended route.
Can the agent change my environment?
The tools listed in the documentation are for reading and analysis. For any write operation, explicitly add another tool and another token, and keep manual approval.
Conclusion
Dynatrace in Cursor is worth it for the loop it closes: code, deploy, observe, fix without switching context. The mechanics are simple, one URL and one token, but the guardrails make the difference: minimal permissions, approval, query review. Start small, with one service and one read token, then extend.
Sources read: Dynatrace MCP server and MCP in Cursor.
span.observer is an independent community blog, not affiliated with Dynatrace LLC or Cursor (Anysphere). Brands mentioned belong to their owners. We did not test this connection: commands and configuration come from the official documentation, to be checked against your version.