Datadog APM ingestion decides which traces enter the platform; retention decides which ones stay searchable. The two settings are separate, and mixing them up is expensive: you filter in one place hoping to cut the bill while the volume is decided elsewhere. This article separates the stages of the trace pipeline, based on Datadog’s official documentation.
It is written for SRE and platform teams already running Datadog APM who want to keep the useful traces (errors, high latency) without paying for the rest. Values quoted come from the Datadog documentation pages read on 30 October 2026; they may change, so check the page before hard-coding them in a runbook.
In brief
- Ingestion: the spans sent by SDKs and the Agent to Datadog. It is tuned with ingestion controls and sampling.
- Indexing: among ingested spans, retention filters choose which ones are stored and searchable, for 15 days with custom filters.
- Metrics: they are computed from ingested spans, whether or not those spans are indexed.
- A retention filter does not reduce ingestion: the documentation says so explicitly.
Datadog APM ingestion: three stages not to confuse
The Trace pipeline page describes the whole chain: ingestion, processing pipelines, indexing and retention, generated metrics, usage tracking. For an SRE, three questions are enough to find your way.
- What is sent? That is ingestion. The SDK and the Agent decide, trace by trace, to keep or drop.
- What is stored and queryable? That is indexing, driven by retention filters.
- What is aggregated into curves? Those are metrics, computed on what was ingested.
A span dropped at ingestion no longer exists for the next two stages. According to the span-based metrics documentation, a span discarded by sampling cannot produce a metric. Conversely, a span that is ingested but not indexed still feeds those metrics. For the RED side, see our article on Datadog trace metrics.
Ingestion controls: head-based sampling
The Ingestion Control page shows month-to-date ingestion, the end-of-month projection against your allotment, and a per-service table (traces per second and bytes per second over the last hour). A graph per “ingestion reason” ties each volume to a precise mechanism.
By default, sampling is head-based: the decision is made on the root span and applies to the whole trace. According to the documentation, when no rule is set for a service the Agent aims for 10 traces per second and computes the rates itself. You can change this target in Datadog or with DD_APM_TARGET_TPS (key target_traces_per_second in datadog.yaml).
Two samplers complete this mechanism for traces that head-based sampling did not keep: the error sampler (10 error traces per second per Agent by default, DD_APM_ERROR_TPS) and the rare sampler (disabled by default, DD_APM_ENABLE_RARE_SAMPLER, Agent 7.41 or later).
Writing rules in the SDK
Rules are set on the application side with DD_TRACE_SAMPLING_RULES, a JSON array where sample_rate runs from 0 to 1. The example below comes from the documentation: every GET /checkout trace is kept, and 20% of the service’s other traces.
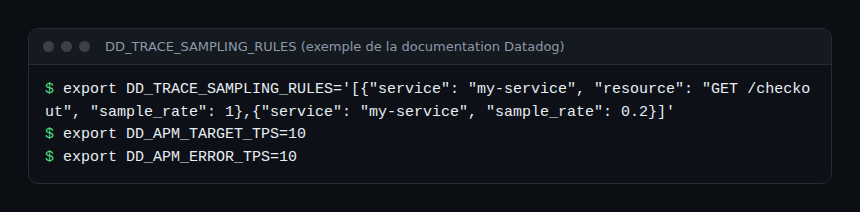
Precedence: according to the documentation, tracer settings override Agent settings, and remote configuration overrides local configuration. When a rate does not behave as expected, first check which of the Agent, the tracer or remote configuration has the last word.
Reading ingestion reasons
Every ingested trace carries a reason. The Ingestion Mechanisms page lists several: auto, rule and manual belong to head-based sampling; error and rare come from the Agent’s samplers; single_span keeps individual spans; otel flags OpenTelemetry data.
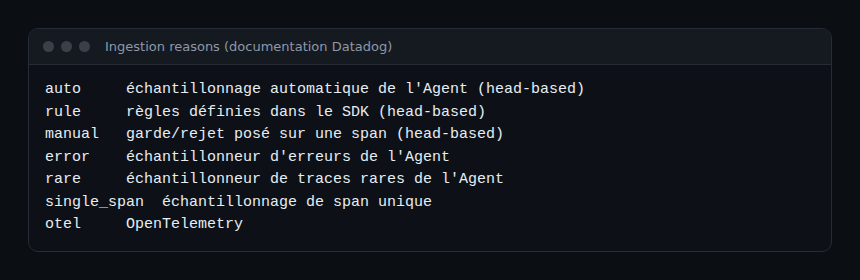
Single span sampling (single_span) keeps spans that head-based sampling dropped, without keeping the whole trace. It cannot drop spans already kept. It is useful to count one specific call without paying for complete traces.
Retention filters and indexed spans
Once a span is ingested, the Trace retention page explains what makes it searchable. Two families of filters coexist.
The intelligent retention filter
It is always on and runs alongside your own filters. It combines two mechanisms:
- Diversity sampling: at most every 15 minutes, at least one trace per combination of environment, service, operation and resource; traces at the p75, p90 and p95 latency percentiles; a varied selection of errors (400s, 500s). It is biased towards errors and high latency, so it is not a proportional sample of traffic.
- 1% flat sampling: about 1% of ingested spans, decided on the
trace_idso a trace stays whole, plus traces linked to 1% of ingested RUM sessions.
According to the documentation, the spans it indexes do not count towards indexed-span usage and so do not affect the bill. The page states a 30-day retention. The “1%” is therefore not an overall keep rate: it is a uniform share, completed by diversity, and a low-traffic service may be missing from short time ranges.
Custom filters
They retain for 15 days. Each filter has a retention query (any span tag or attribute, such as env:prod or @duration:>2s), a span rate from 0 to 100% and, optionally, a trace rate that indexes the whole trace, including spans that do not match the query.
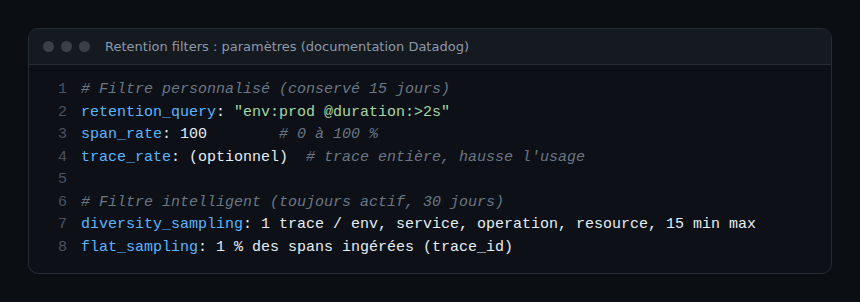
The span rate is evaluated first; the trace rate applies only to traces it selected. The documentation notes it can significantly increase indexed-span usage. Filters are evaluated in list order: a span kept by one filter is not reconsidered by the next ones.
Watching cost and usage
The datadog.estimated_usage.apm.indexed_spans metric tracks spans indexed by custom and default filters. The APM Estimated Usage and Ingestion Reasons dashboards show ingested and indexed volumes. Prices are not repeated here: see Datadog’s official pricing page for current amounts.
This makes a good health indicator for the observability platform itself: track it like any internal SLI, with an alert before the monthly allotment runs out. An alert combining several conditions can be built with a Datadog composite monitor.
Steps to frame your trace pipeline
- Open the Ingestion Control page and spot the services whose volume dominates, and the main ingestion reason.
- Decide, service by service, what must be kept at 100% (critical paths, payment) and what can go lower, using
DD_TRACE_SAMPLING_RULESrules. - Create targeted retention filters (
env:prod, high duration, error status) rather than one global rate. - Keep the intelligent filter as a safety net, without treating it as a representative sample.
- Create metrics from ingested spans for long-term SLOs, instead of indexing traces to count.
- After each change, recheck the ingestion reasons and the indexed usage metric.
How to check it works
After a rule change, look at the per-reason ingestion graph on the Ingestion Control page: the expected volume should move to the rule reason. In the Trace Explorer, search for a known case (a recent error on the changed service) and confirm its trace is indexed. If it does not appear, the decision was made at ingestion, not at retention.
Link with OpenTelemetry and Dynatrace
OpenTelemetry data sent to Datadog carries the otel reason listed above. To understand the difference between head and tail sampling on the OpenTelemetry side, see our article on OpenTelemetry tail sampling: the decision logic differs, because it waits for the end of the trace. For an overview of both platforms, see the Dynatrace and Datadog comparison. This text describes Datadog; it claims no feature equivalence with Dynatrace.
Best practices
- Separate ingestion, indexing and metrics in your head before touching a setting.
- Keep 100% of error and high-latency traces on critical journeys.
- Avoid high trace rates in custom filters without measuring the impact on usage.
- Document the rules in the application repository, not only in the interface.
- Review the rules whenever traffic or allotment changes.
Frequently asked questions
What is the difference between ingestion and indexing in Datadog APM?
Ingestion is sending spans to Datadog, tuned by sampling. Indexing is the searchable storage of part of the ingested spans, driven by retention filters. A retention filter does not reduce ingestion.
Does the intelligent filter really keep 1% of traces?
Not only that. It combines a diversity sample, biased towards errors and latency, and a uniform sample of about 1% of ingested spans. It is not a proportional sample of traffic.
Can you keep metrics without indexing traces?
Yes. Span-based metrics are computed on ingested spans, indexed or not. They are billed as custom metrics, so avoid high-cardinality attributes.
Conclusion
To control Datadog APM, tune ingestion first, then index with targeted filters, and rely on metrics for the long term. Check every value against the documentation for your Datadog site, as defaults may change.
- Trace pipeline, Datadog documentation
- Trace retention, Datadog documentation
- Ingestion Control, Datadog documentation
span.observer is an independent blog, not affiliated with Dynatrace LLC or Datadog Inc. Product names belong to their respective owners; values come from the Datadog documentation read on 30 October 2026 and the examples are taken from that documentation.