Monday, 8:55 am: the NOC team opens three tabs, one per environment (production, pre-production, a hosted customer), and compares charts by eye. Every switch costs time, and an incident that hits two environments at once goes unnoticed. A Dynatrace multi-environment dashboard solves this: tiles from other environments sit side by side on a single screen.
This practical guide shows how to build these cross-environment dashboards in Dynatrace Managed: what they are for, the token and connection to create, tile configuration step by step, how management zones behave, documented limits, permissions, automation through the API and Monaco, and common pitfalls.
The content targets classic Dashboards in Dynatrace Managed. The feature also exists in classic Dashboards on Dynatrace SaaS, with one notable difference: the network scope there is always EXTERNAL. The new platform Dashboards in SaaS (Grail, DQL) are not covered here.
Why a Dynatrace multi-environment dashboard
A Managed cluster often hosts several environments, isolated from one another: data, settings, users. That isolation is healthy, but it fragments the big picture. A multi-environment dashboard keeps data isolation and adds a cross-cutting view. Three cases come up often:
- NOC view: a single wall screen with host health, open problems and key response times for each environment.
- Production and pre-production: the same tile placed twice, one per environment, to compare behaviour before and after a release.
- Multi-customer: a hosting provider that gives each customer an environment and wants an internal summary dashboard.
For SREs, the gain shows in MTTR: you see straight away whether a degradation is local or shared, without switching tabs. The principle is documented: tiles can show metrics, logs, events, user sessions and server-side traces from a remote environment.
How the connection between environments works
The connection is one-way. The dashboard lives in the local environment; it reads data from a remote environment that must authorise it with a token. For a NOC view over three environments, you therefore pick one environment to host the dashboard and declare the other two as remote.
Three objects are involved:
- a token in the remote environment, with the Fetch data from a remote environment scope (
RestRequestForwarding); - an entry in Settings > Integration > Remote environments of the local environment;
- the environment choice in the Environment section of each tile.
Choosing the network scope
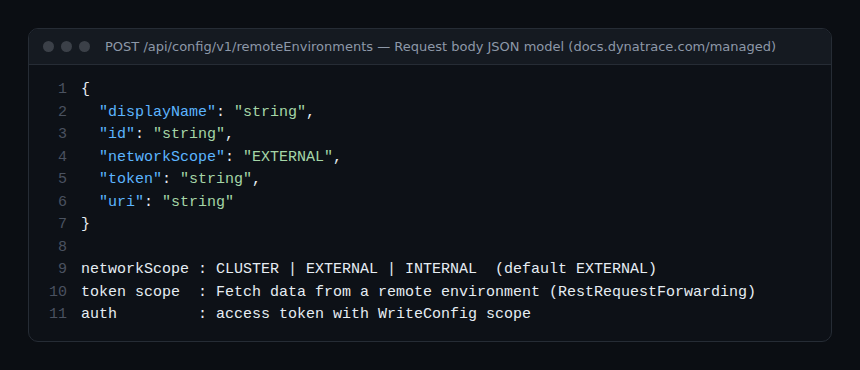
EXTERNAL(default): the remote environment is on another network; the global proxy, if any, is used.INTERNAL: same network, without the global proxy.CLUSTER: same Managed cluster; the request goes tolocalhost.
For two environments in the same cluster, CLUSTER is the natural choice: no detour through the proxy or public DNS. The documentation also states that Dynatrace Managed accepts any URI for the remote environment.
Set up a multi-environment dashboard step by step
Step 1: create the token in the remote environment
- Sign in to the remote environment (the one that provides the data).
- Open Access Tokens, then Generate new token.
- Give the token an explicit name, for example
remote-dashboards-noc. - Select only Fetch data from a remote environment (
RestRequestForwarding). - Generate, copy and store the token in your secrets vault.
Through the API, the same token is created with POST /api/v2/apiTokens (the caller needs the apiTokens.write scope):
curl -X POST "https://{your-domain}/e/{remote-env-id}/api/v2/apiTokens" \
  -H "Authorization: Api-Token $ADMIN_TOKEN" \
  -H "Content-Type: application/json" \
  -d '{"name": "remote-dashboards-noc", "scopes": ["RestRequestForwarding"]}'
Step 2: declare the remote environment
- In the local environment, open Settings > Integration > Remote environments.
- Select Connect environment.
- Fill in Name (the name shown in tiles, for example
Preprod), Remote environment URI, Network scope and Token. - Select Test connection and wait for the connection successfully established message.
- Save with Save changes.
The name is free-form and changes nothing on the remote side: choose it for the on-call engineer (“Prod-EU”, “Customer-A”), not for the platform team.
Step 3: point a tile to the remote environment
- Open the dashboard and select Edit.
- Select or add the tile (for example a Data Explorer tile).
- In the Environment section of the settings pane, replace Default (local) with the name of the remote environment.
- Select Done.
For a side-by-side comparison, the documentation suggests a simple layout: a Header tile “Local”, another “Remote”, the same tiles under each, and the right-hand ones pointed to the remote environment. Cloning tiles (Clone x tiles) speeds this up considerably. For building the tiles themselves, see the Dynatrace Managed dashboard guide: tiles and JSON and the Data Explorer guide.
Supported tiles, filters and management zones
The documentation does not publish an exhaustive list of compatible tiles. It names a single explicit exclusion: the world map tile does not support remote environments. It adds that a remote tile only shows features present in the remote cluster version; otherwise the tile shows an error message explaining the difference. So test each tile type before putting a screen into production.
Filters behave as follows:
- A tile that offers Custom management zone can use a management zone from the remote environment.
- The tile filter (
tileFilterin JSON) overrides the dashboard filter (dashboardFilter). - Selecting a remote tile opens a view of the remote environment. If the dashboard is filtered by management zone, that filter carries over and replaces the default zone, only if the zone name is identical in both environments.
In practice: align management zone names across environments (“App-Payment” everywhere, not “payment-prod” on one side). The method is covered in management zones and tagging.
Limits, performance and permissions
Version compatibility
A remote tile is backward compatible across five versions: a tile in an environment on version x works with a remote environment on x minus 5 or later. Beyond that it may work but is not supported. Within one Managed cluster, environments share the cluster version; the question mostly arises between separate clusters.
Performance
The Managed documentation gives no latency figure or quota specific to remote tiles. A remote tile is one more query to another environment: limit the number of remote tiles per screen, prefer aggregated queries (top N, few series) and avoid long timeframes on a continuously refreshed wall screen. These are common-sense precautions, not official thresholds.
Permissions and sharing
Key point: the connection carries neither user context nor permissions from one environment to another. Remote data is read with the token. That is why only environment administrators can configure these dashboards; everyone else can then view them without restriction. The Dashboards API confirms it: a non-admin change to a dashboard containing remote tiles returns 403.
Before sharing such a dashboard, ask yourself: can a reader see data from an environment they have no access to? If so, restrict each remote tile by management zone. Sharing rules remain those of classic dashboards: a view-only user cannot share or edit, but can clone.
Automate with the API and Monaco
Three APIs cover the full path, all documented for Managed:
- Access tokens API:
POST /api/v2/apiTokens, for the remote token; - Remote environments API:
POST /api/config/v1/remoteEnvironments(WriteConfigscope). It is deprecated: the documentation points to the Settings API and thebuiltin:remote.environmentschema; - Dashboards API:
/api/config/v1/dashboards(ReadConfigto read,WriteConfigto write).
curl -X POST "https://{your-domain}/e/{local-env-id}/api/config/v1/remoteEnvironments/validator" \
  -H "Authorization: Api-Token $CONFIG_TOKEN" \
  -H "Content-Type: application/json" \
  -d '{"displayName": "Preprod",
       "uri": "https://{your-domain}/e/{remote-env-id}",
       "networkScope": "CLUSTER",
       "token": "<RestRequestForwarding token>"}'
A 204 means the payload is valid. On creation, Dynatrace tests the URI and token; if that fails, nothing is created. GET requests return the token field as null.
Caution: the Dashboards API reference page does not document the JSON field that holds a tile’s remote environment (the documented TileFilter only exposes managementZone and timeframe). For your templates, export a real dashboard (More > Export) and start from that JSON rather than guessing the key.
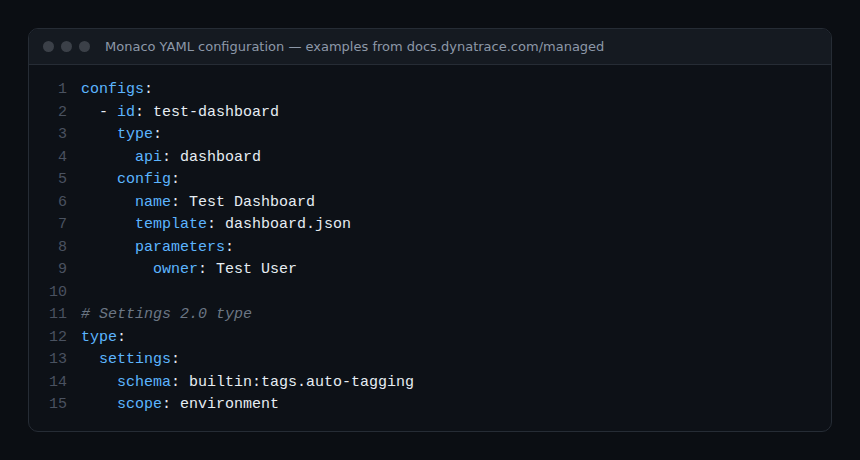
With Monaco, a classic dashboard is declared as type api: dashboard, and the remote connection can be managed as a Settings 2.0 object (schema: builtin:remote.environment). The token must never be committed: inject it through an environment variable. See Monaco, configuration as code.
What about the Cluster Management Console? It administers the cluster and its environments, but it is not documented as a dashboard tool for application data: for a cross-cutting business view, the multi-environment dashboard is what you need to build.
How to check that it works
- Test connection shows connection successfully established in Remote environments.
- Hovering over the tile filter icon shows the remote environment name.
- The remote tile values match the same query run directly in the remote environment (Data Explorer).
- Selecting the tile opens the remote environment with the expected management zone.
Best practices
- One token per local environment,
RestRequestForwardingscope only, scheduled rotation. CLUSTERscope between environments of the same Managed cluster.- Same management zone names everywhere, and a zone on every sensitive remote tile.
- “Prod”, “Preprod”, “Customer-A” headers so nobody wonders where a chart comes from.
- JSON templates taken from a real export, versioned with Monaco, no secrets in the repository.
Common pitfalls
- Verification failed, please check your settings: Constraints violated. when adding: the documentation points to a dedicated troubleshooting article; check URI, token and network scope first.
- Management zone filter “lost” on click: names differ between environments.
- Tile in error after an upgrade: more than five versions apart, or a feature missing on the remote side.
- Revoked or expired token: every remote tile fails at once. Watch its expiry (see troubleshooting a Dynatrace API token).
Frequently asked questions
Do I need a token for two environments in the same cluster?
Yes. Even with the CLUSTER scope, the connection uses a token from the remote environment with the RestRequestForwarding scope.
Does a user without rights on the remote environment see the data?
Yes, if they can open the dashboard: permissions do not cross environment boundaries. Restrict tiles by management zone.
Are all tiles compatible?
The documentation explicitly excludes the world map and warns that a tile fails if the feature is missing on the remote side. No complete list is published: test.
Conclusion
A Dynatrace multi-environment dashboard needs little configuration: a token, a connection, an environment choice per tile. The real work lies elsewhere: controlling permissions, aligning management zones and versioning everything. Done well, it gives the NOC a single view and shortens diagnosis. Reference: Create multi-environment dashboards and Remote environments API.
span.observer is an independent community blog, not affiliated with Dynatrace LLC. Dynatrace is a trademark of its owner. Examples are provided for guidance only: check them against the official documentation for your version.