Since version 9.3, Elastic Agent is built on the EDOT Collector: it is an Elastic Agent OpenTelemetry Collector. Before, it supervised Beats subprocesses (Filebeat, Metricbeat). Now logs, metrics and traces flow through a single OpenTelemetry pipeline, according to the Elastic Observability Labs blog.
For an SRE or platform team the question is simple: what does the upgrade break, and what does it gain? This article sorts what stays compatible from what moves, based on Elastic’s documentation and release notes. It measures nothing: every figure quoted comes from the vendor.
In brief
- From 9.3, the agent is built on the EDOT Collector; before, it drove separate Beats processes.
- According to Elastic, existing
elastic-agent.ymlfiles, integrations, Fleet policies, dashboards and alert rules keep working. - Data from Beats receivers lands in the same data streams as before.
- Stand-alone mode does not support Elastic Defend, Cloud Security or Profiler.
Elastic Agent OpenTelemetry Collector: what changes in the architecture
Up to 8.x, the agent was a supervisor. It started one Beat process per type of collection and watched its health. In 9.3, those Beat inputs and processors run inside the OpenTelemetry pipeline as “Beats receivers”. Elastic’s article announces lower memory overhead without giving a figure, and promises further reductions in future releases. Treat that gain as an intention, not a measurement.
The Elastic Agent 9.3.0 release notes spell out the move. The agent ships a single elastic-otel-collector binary that bundles the OpenTelemetry Collector, Beats receivers and Beat modules. The notes mention an install roughly 200 MB smaller. OpenTelemetry components are updated to v0.141.0.
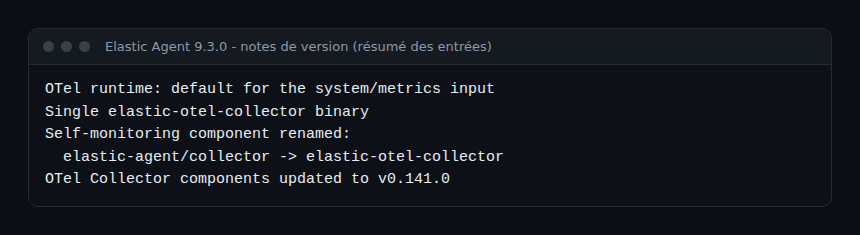
The operational point: the self-monitoring component name changes from elastic-agent/collector to elastic-otel-collector. If a dashboard or alert filters on the old name, check it before you roll out.
What stays compatible
Elastic describes the upgrade as transparent because inputs and outputs are the same. According to the same article:
- existing
elastic-agent.ymlfiles need no change; - integrations, dashboards, Fleet policies, alert rules and ingest pipelines keep working;
- one agent policy can mix ECS-schema Beats data with native OTLP data, applying OpenTelemetry processing before export;
- when native OpenTelemetry data arrives, Elastic installs the matching dashboards and alerts automatically.
The release notes add a useful nuance. The OTel runtime becomes the default for the system/metrics input. It also becomes the default for a list of Metricbeat inputs (Apache, Docker and Linux metrics, among others) when the output is Elasticsearch. Your data should keep its shape, but the execution path changes: test those inputs in pre-production.
Fleet, stand-alone mode and Hybrid Agents
In managed mode, Fleet translates the policy into OpenTelemetry configuration internally. Elastic presents this as the option for “most deployments”. Only managed mode supports Elastic Defend, Cloud Security and Profiler.
Fleet also handles the lifecycle: target version, scope (all agents, a policy group or a canary subset), rolling upgrade with per-agent status. The article on centrally managed collectors notes that 8.x agents upgraded to 9.3 through Fleet become Hybrid Agents.
Stand-alone mode suits environments where the full agent cannot be installed, or where another tool manages configuration. It supports Beats receivers and the native OpenTelemetry pipeline, and a stand-alone agent can enrol in Fleet later without reinstalling. Elastic does not recommend it for most users.
What the OpenTelemetry configuration looks like
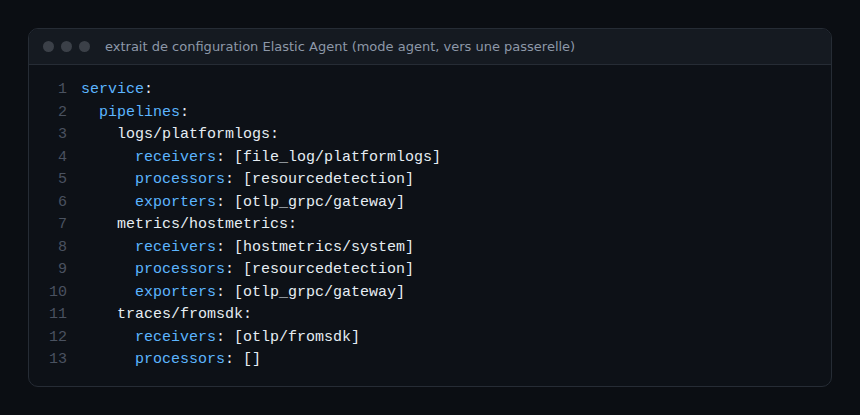
In OpenTelemetry mode, the agent reads the standard Collector configuration: receivers, processors, exporters and connectors, wired together in service.pipelines. Elastic’s documentation publishes examples; here is an excerpt from an “agent” configuration that sends everything to a gateway over OTLP/gRPC.
service:
  pipelines:
    logs/platformlogs:
      receivers: [file_log/platformlogs]
      processors: [resourcedetection]
      exporters: [otlp_grpc/gateway]
    traces/fromsdk:
      receivers: [otlp/fromsdk]
      processors: []
Each pipeline links one or more receivers to an exporter and carries a single signal. Do not mix types: a logs pipeline carries logs, a traces pipeline carries spans. For Collector basics, see our guide on the OpenTelemetry Collector on Kubernetes.
Before you upgrade: a checklist
- Read the 9.x release notes for Elastic Agent and the breaking changes page linked from 9.3.0.
- Search for the old component name
elastic-agent/collectorin your dashboards, alerts and queries. - Sort your agents: Fleet-managed or stand-alone, and which need Elastic Defend, Cloud Security or Profiler.
- Test a canary subset with Fleet’s rolling upgrade, on Metricbeat inputs that moved to the OTel runtime.
- Compare data streams before and after: volumes, fields, ingest latency.
- Plan a rollback: keep the previous version available for the canary.
How to check it works: after the canary, agents stay healthy in Fleet, data streams receive documents, and your alert rules fire on a test case. A gap in the data is your stop signal.
What this changes for an SRE team
The main gain is convergence: one agent speaks the language of the OpenTelemetry stack, can receive data from any compatible source, and can emit to compatible destinations. That cuts the toil of maintaining several agents and makes tools easier to compare. You can also reuse the sampling and filtering ideas from our tail sampling guide.
One scope limit remains. Elastic says that managing stand-alone agents and third-party collectors in Fleet is a planned capability, and that management will move to OpAMP in time: it is not available today. A third-party Collector is therefore not managed by Fleet.
What about Dynatrace? A standard OpenTelemetry Collector can export OTLP to Dynatrace, as in the guide above. I have not verified that an Elastic Agent in OpenTelemetry mode is documented for that use, so do not assume it without testing. To place the approaches, also read observability vs monitoring and our comparison with Datadog.
Best practices
- Read the exact version number in the release notes before each upgrade, not in a blog post.
- Upgrade in stages, starting with a canary group.
- Keep one signal per OpenTelemetry pipeline.
- Measure memory and CPU yourself: the announced gains are not quantified.
Frequently asked questions
Do I need to rewrite my Fleet policies to move to 9.3?
According to Elastic, no: existing Fleet policies, integrations and configurations keep working, because Fleet translates the policy into OpenTelemetry configuration internally. Still, test on a canary.
Is stand-alone mode equivalent to Fleet-managed mode?
No. A stand-alone agent supports Beats receivers and the native OpenTelemetry pipeline, but not Elastic Defend, Cloud Security or Profiler. Elastic does not recommend it for most users.
How does this differ from the EDOT Collector?
Before 9.3, the EDOT Collector was a separate product. From 9.3, according to Elastic, Elastic Agent is built on it and exposes the same OpenTelemetry capabilities. See the Elastic Agent documentation.
Conclusion
Elastic Agent 9.3 changes engine, not contract: same inputs, same outputs, according to Elastic. Check component names, the inputs moved to the OTel runtime and your deployment mode, then roll out by canary. Sources: centrally managed collectors with Fleet and the release notes.
span.observer is an independent blog, not affiliated with Dynatrace LLC or Elastic N.V. Product names belong to their respective owners; the Elastic information comes from its public documentation and may change: check the version of your own deployment.