
For Elasticsearch monitoring Dynatrace offers a documented route, the Elasticsearch extension: it queries the cluster’s REST API and sends metrics to Dynatrace, with no agent inside the cluster itself. This tutorial covers prerequisites, activation, pitfalls and cost as described in the Dynatrace documentation (page updated 15 June 2026, read on 30 October 2026).
The problem is a familiar one for SRE teams: an Elasticsearch cluster goes from green to yellow or exhausts its heap, and the alert arrives late or not at all. The goal here is to get cluster, node, index and disk health into Dynatrace with basic alerts, while avoiding duplicate data and billing surprises.
The content relies on the extension documentation, published in the SaaS section of docs.dynatrace.com. We have not verified availability for Dynatrace Managed: check it in your own cluster before planning.
What the Elasticsearch monitoring Dynatrace extension does
According to the Dynatrace documentation, extensions are modular packages that describe how to collect and structure metrics, events and logs from external sources. They run through the Extension Execution Controller (EEC), on an ActiveGate (remote collection) or on a OneAgent host (local collection).
For Elasticsearch, the extension page lists five scraped endpoints: /_cluster/health, /_all/_stats?level=shards, /_nodes/stats, /_alias and /_cat/shards. Metrics are grouped into feature sets that you enable selectively: cluster health, node CPU, memory and filesystem, JVM and file descriptors, network, caches, circuit breakers and thread pools, operations, indexes, disk performance. Each feature set has a basic and an advanced variant, apart from a few exceptions.
Prerequisites: versions, network and roles
Per the documentation, the extension requires Elasticsearch 8.0 or higher. OpenSearch 2.12.0 is mentioned, with the caveat that full compatibility is not guaranteed: treat it as a trial, not as support. The cluster must be reachable from the ActiveGate running the extension; a OneAgent-instrumented host can also run it using the localhost address.
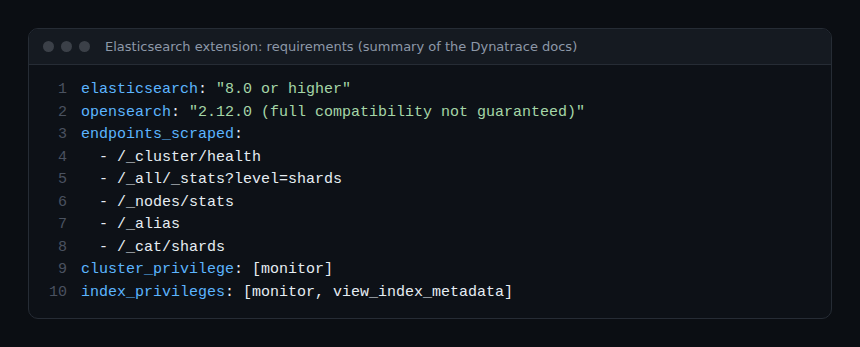
On permissions, the monitoring user needs the monitor cluster privilege and the monitor and view_index_metadata index privileges. The Elastic privileges documentation spells out their scope: cluster-level monitor covers read-only operations such as cluster health and state, node and cluster stats, and pending cluster tasks. At index level, monitor covers monitoring actions (recovery, segments, index stats), and view_index_metadata gives read-only access to index metadata, including aliases. None of these allows data changes: this is least privilege applied to monitoring.
Create a dedicated role and a service user rather than reusing an administrator account. The exact role-creation syntax depends on your deployment (self-managed, Elastic Cloud, ECK): follow the matching Elastic page; we do not reproduce it because we did not verify it for every case.
Enable the extension step by step
The route documented by Dynatrace has three steps.
- In Dynatrace, download the Elasticsearch extension, then select Add monitoring configuration next to an extension version under Versions.
- Select the host that will run the collection, then enter the Elasticsearch instance URL and the monitoring user’s credentials.
- Select the feature sets whose metrics you want to import.
The page does not detail the extension 2.0 configuration fields or ActiveGate and EEC settings beyond the reachability requirement. We do not make them up: read the fields shown in your environment’s wizard.
One host per cluster
This is the main pitfall. If you activate the extension on several hosts of the same cluster, you receive duplicate cluster data. The documentation asks you to activate it on a single host per cluster, especially when it runs locally through OneAgent. In practice, pick one ActiveGate per cluster and record the choice in your runbook so a colleague does not add a second configuration “to be safe”.
How to check that it works
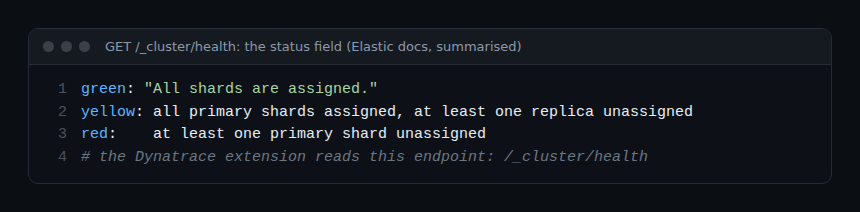
Start with the source of truth: query /_cluster/health yourself with the monitoring account. According to the Elastic documentation, the status field is green when all shards are assigned, yellow when all primaries are assigned but not all replicas, and red when at least one primary is not.
Then open the overview dashboard shipped with the extension and the unified analysis pages in Dynatrace. The documentation lists pages for each entity type (clusters, nodes, indexes, disks, thread pools), plus topology and relationships between them. If the cluster does not appear, check in order: the URL, the credentials, reachability from the ActiveGate, then the user’s privileges.
To cross-check a value, compare the node count or health state shown in Dynatrace with the API response: the number_of_nodes, unassigned_shards and number_of_pending_tasks fields match the cluster health metrics described for the extension (health, node count, unassigned shards, pending tasks).
Built-in alerts and SLOs
The page lists five built-in alerts: total CPU above 85%, filesystem usage above 80%, open file descriptors above 80% of the maximum, heap used above 85%, and rejected threads above 300. These are default thresholds, not SLOs. For an SLO, start from what users feel: search latency, the error rate of the application querying Elasticsearch. Cluster metrics then help explain a consumed error budget, and so cut MTTR. Our article on the difference between observability and monitoring explains why the two layers complement each other.
Cost: data points and licensing
The extension is free; you pay only for ingested metric data points. With all feature sets enabled, the documentation gives this formula, in points per minute: 12 × clusters + 53 × nodes + 47 × indexes + 5 × disks + 5 × thread pools. Logs and custom events triggered by the extension are billed separately.
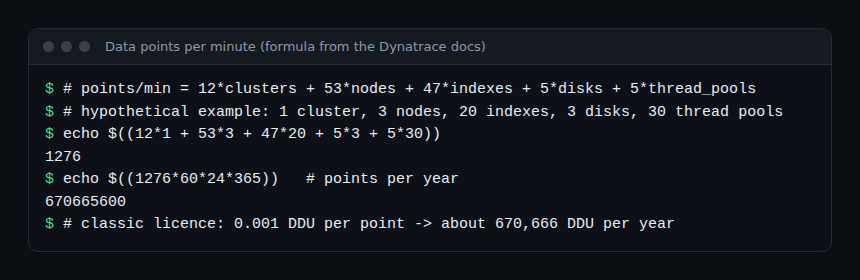
Our hypothetical example (1 cluster, 3 nodes, 20 indexes, 3 disks, 30 thread pools) gives 1,276 points per minute, or 670,665,600 per year. With a classic licence, the documentation states 0.001 DDU per point, about 670,666 DDU per year; with a Dynatrace Platform Subscription, consumption falls under Metrics powered by Grail. These figures are a calculation from the vendor’s formula, not a measurement. The dominant item is the index count (47 points each): if you have many indexes, enable only the feature sets you need, since the documentation says they are selectable.
Best practices
- A dedicated read-only role, never an administrator account.
- One configuration per cluster, recorded in the runbook.
- Start with basic feature sets, then add advanced ones if an incident justifies it.
- Estimate the cost with the formula before rolling out to every cluster.
- Treat OpenSearch as a trial: full compatibility is not guaranteed.
What about OpenTelemetry?
The extension covers Elasticsearch infrastructure metrics. It does not replace tracing for the applications that call it. For those, OpenTelemetry instrumentation remains the standard route, sent to Dynatrace through a Collector (see our guide to the OpenTelemetry Collector on Kubernetes). If you compare with other tools, our Dynatrace and Datadog comparison provides the frame. We claim no OpenTelemetry integration specific to this extension: the documentation we read does not mention one.
Frequently asked questions
Which Elasticsearch versions are supported?
The documentation states Elasticsearch 8.0 or higher. OpenSearch 2.12.0 is mentioned, without a guarantee of full compatibility.
Why are my cluster metrics duplicated?
You probably activated the extension on several hosts of the same cluster. The documentation recommends a single host per cluster.
Is the extension free?
It is free, but ingested metric data points are billed (0.001 DDU per point on a classic licence, per the Dynatrace documentation read on 30 October 2026). Check your contract before rolling out.
Conclusion
Monitoring Elasticsearch with Dynatrace comes down to three decisions: a read-only user, a single host per cluster and feature sets chosen against your data-point budget. The rest can be checked with the health API and the analysis pages.
Sources
- Elasticsearch extension, Dynatrace documentation
- Extensions, Dynatrace documentation
- Cluster health API, Elastic documentation
- Security privileges, Elastic documentation
span.observer is an independent blog, not affiliated with Dynatrace LLC or Elastic N.V. Product names belong to their respective owners; the figures in the examples are hypothetical.