Kronos financial markets forecasting is what the shiyu-coder/Kronos repository is about: a family of foundation models pre-trained on financial candlesticks (OHLCV series, called “K-lines” in the README) to forecast market time series. The project shows about 43,000 stars and 7,100 forks as of the check on 22 October 2026, under the MIT licence. This guide is about the tool, not about finance: it contains no investment advice and no promise of returns, and nothing here says a model predicts markets well.
Why cover it on an observability blog? Because a forecasting model is a production component like any other: it has latency, GPU memory use, inputs to validate and a quality that degrades. Here is how to read it, install it from the README and monitor it.
A note on honesty: span.observer has not installed or run Kronos. The commands come from the README, the first two images are figures from the repository, and the third is a code extract from the README.
Kronos financial markets foundation model: what the repository says
- Licence: MIT (the repository’s LICENSE file). Language: Python; dependencies listed in
requirements.txt(includingtorch>=2.0.0,pandas,huggingface_hub,safetensors). - Figures checked on 22 October 2026: about 43,000 stars, about 7,100 forks. No release is published on the repository page. The latest commit on the main branch that we read dates from 13 April 2026: the repository has not moved for several months, which matters for maintenance.
- Who is behind it: a group of researchers; the README points to an arXiv paper (2508.02739) and states its acceptance at the AAAI 2026 conference. These are README claims that we have not checked with the conference.
- What the project claims: to be “the first open-source foundation model” for candlesticks, trained on data from more than 45 global exchanges.
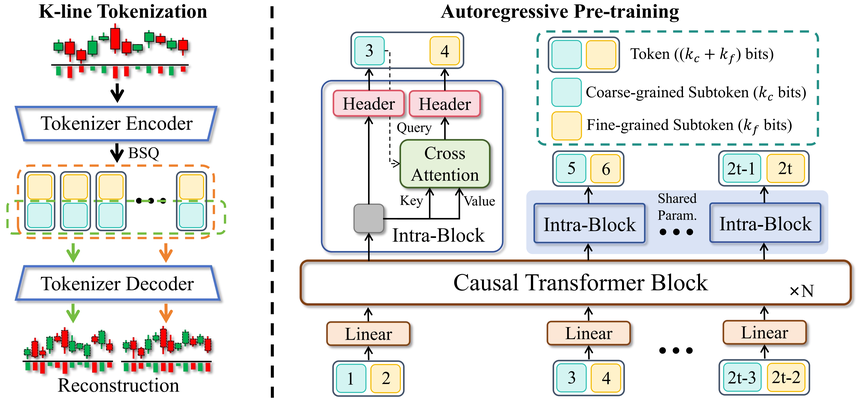
The principle, according to the README: a tokenizer quantises continuous, multi-dimensional data (open, high, low, close, volume) into hierarchical discrete tokens, then a large decoder-only autoregressive Transformer is pre-trained on those tokens.
The model family
The README lists four sizes, all available from Hugging Face (NeoQuasar space) except the largest:
- Kronos-mini: 4.1M parameters, 2048 context; tokenizer Kronos-Tokenizer-2k.
- Kronos-small: 24.7M parameters, 512 context.
- Kronos-base: 102.3M parameters, 512 context.
- Kronos-large: 499.2M parameters, 512 context, not released (marked with a cross in the README table).
Step-by-step installation
- Install Python 3.10 or newer (README prerequisite), then clone the repository.
- Install the dependencies:
pip install -r requirements.txt - Load the tokenizer and a model from Hugging Face, then create the predictor:
from model import Kronos, KronosTokenizer, KronosPredictor tokenizer = KronosTokenizer.from_pretrained("NeoQuasar/Kronos-Tokenizer-base") model = Kronos.from_pretrained("NeoQuasar/Kronos-small") predictor = KronosPredictor(model, tokenizer, max_context=512) - Prepare a pandas DataFrame with the columns
open,high,low,close(volumeandamountare optional), the historical timestampsx_timestampand the timestamps to forecasty_timestamp. - Call
predict:
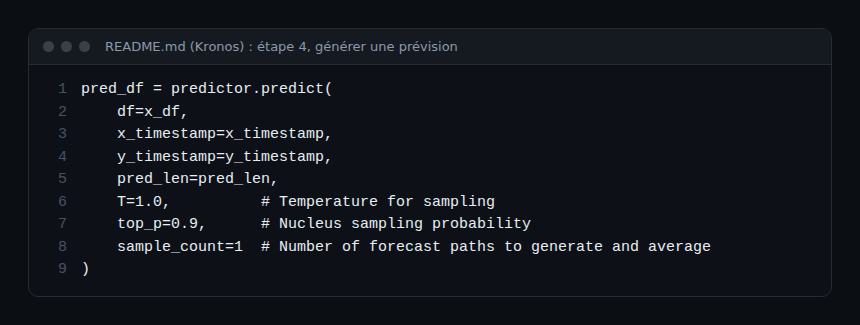
The README states that max_context is 512 for Kronos-small and Kronos-base and recommends not exceeding that history length; T sets the sampling temperature, top_p the nucleus sampling and sample_count the number of generated paths that are averaged. The method returns a DataFrame with the forecast values. A predict_batch method handles several series in parallel, provided they share the same history and forecast lengths.
What you can see of how it works
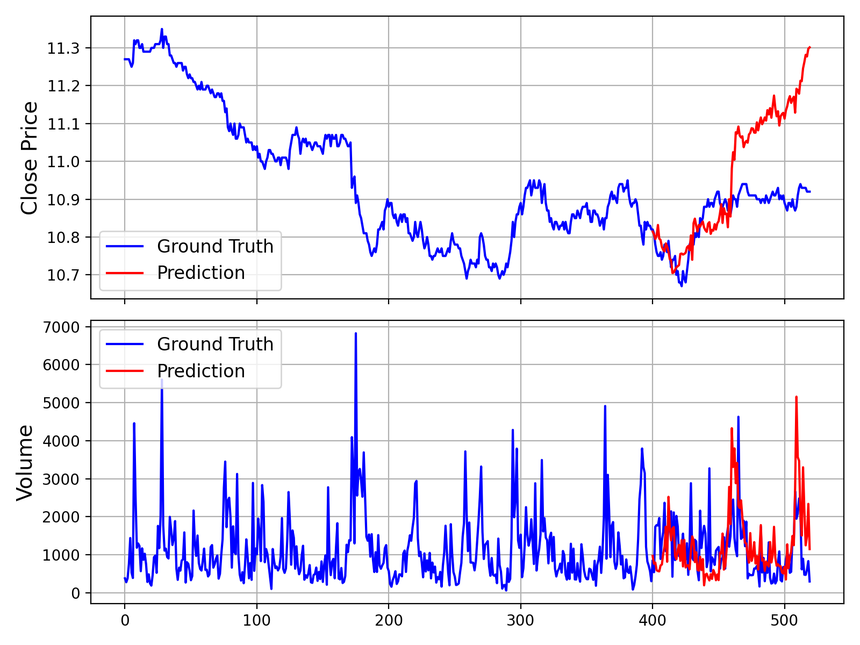
The examples/prediction_example.py script produces a chart comparing the actual values (“Ground Truth”) with the forecast. The figure below is the README’s. Look at it without making it say more than it shows: towards the end of the window, the forecast curve moves clearly away from the actual curve. It is an illustrative example from a research project, not a performance measurement.
The webui/ folder contains a Flask web interface: cd webui then python run.py, with a page at http://localhost:7070 according to its README. It lets you load a data file, choose the model and the device (CPU, CUDA or MPS), set temperature, top_p and sample count, and display the result as candlesticks. The README also offers an online demo and a fine-tuning pipeline with Qlib on Chinese equity data.
Limits and open points
- No advice, no guarantee: the README itself calls its fine-tuning and backtest pipeline a demonstration, “not a production-ready quantitative trading system”. A backtest without transaction costs, slippage or market impact says nothing about the real world.
- Context size: 512 points for the small and base models; longer inputs are truncated.
- Maintenance: no published release, latest commit read in April 2026.
- Generated comments: the README says many comments in the
finetune/folder were written by an AI assistant and may contain errors; the code is authoritative. - Data and licences: your market data has its own licence terms, independent of the code’s MIT licence.
Monitoring a forecasting model
Kronos is not a service: it is a Python library that you call. The README describes no metrics or traces. You instrument the call yourself, on Dynatrace SaaS and Dynatrace Managed alike, with OpenTelemetry (see instrumenting a Python application with OpenTelemetry):
- a span around each
predictcall, with the model name,pred_lenandsample_countas attributes; - metrics: inference duration, batch size, and peak GPU memory (the PyTorch API
torch.cuda.max_memory_allocatedprovides it); - quality over time: when the actual values arrive, compute the gap with the forecast (for example the mean absolute error) and publish it as a metric. A drift in that gap is the alert signal, not latency alone;
- input logs: row count, missing columns, date range, to catch incomplete data before inference.
These measurements are our suggestion, not a project feature. For cost and quality tracking of other models, see LLM observability with Langfuse and OpenLLMetry.
How to check that it works
pip install -r requirements.txtfinishes without error andimport torchworks.- Loading the models from Hugging Face succeeds; the first call downloads the weights.
- The
examples/prediction_example.pyscript produces a chart with the forecast curve. - Your OpenTelemetry backend shows one span per prediction, with its duration.
Best practices
- Treat the output as a statistical hypothesis, never as an automatic decision.
- Pin the model and tokenizer versions (Hugging Face revision) and record them in your spans.
- Validate inputs: same lengths for
predict_batch, no missing values. - Compare the forecast with a simple baseline before giving it any weight.
- For other models to serve in production, see vLLM, LLM inference in production.
Frequently asked questions
Can Kronos make me money?
This guide makes no promise of returns. The README presents its pipeline as a demonstration, and a time-series forecast is not a strategy. This is not financial advice.
Do I need a GPU?
The web interface offers CPU, CUDA and MPS according to its README. In what we read, the project gives no performance measurement per hardware: test the small models first.
Can I use it in a commercial product?
The code is under the MIT licence, which allows it with the copyright notice. Check separately the licence shown on each Hugging Face model and that of your data.
Conclusion
Kronos is an open research project, useful to understand how candlesticks can be “tokenised” and handled like a language. In operation it is treated like any model: validated inputs, pinned versions, latency and quality drift measured. For another piece of the series, see Hindsight, memory for AI agents. Sources: the shiyu-coder/Kronos repository.
span.observer is an independent community blog, not affiliated with Dynatrace LLC or the projects mentioned. Trademarks belong to their owners. This article is not financial advice. Tools change quickly: check commands and options in their official documentation.