
An LLM gateway is a proxy placed between your applications and the model providers: every request goes through one point, which can count tokens, attribute each expense to a team and cut off an exhausted budget. For an SRE, it is the most direct way to answer “who uses what, and why did the bill double?” without touching the code of every service. This article compares two open source projects, LiteLLM and Helicone, on that single use: tracking costs.
The principle is the same as a classic API gateway: the caller’s identity (virtual key, header) becomes a dimension of the metric. Without it, a global token counter says nothing about which team is responsible. With it, a budget per key and an alert per team become possible.
A note on honesty: span.observer has deployed neither LiteLLM nor Helicone for this article. Snippets, metric names and headers come from the official documentation pages read on 31 October 2026. No cost figure is measured here.
LLM gateway: what the two projects offer
- LiteLLM: the
BerriAI/litellmrepository shows about 62,400 stars on the date of reading. Its LICENSE file states the MIT licence, except theenterprise/directory, which has its own licence. The README presents the proxy as a self-hosted “AI Gateway” for more than 100 LLMs, behind an OpenAI-format interface, with virtual keys, spend tracking, guardrails, load balancing and an admin UI. Release numbers are not quoted here: the repository page did not reliably show any. - Helicone: the
Helicone/heliconerepository is under Apache 2.0 (LICENSE file read), with about 6,200 stars. It describes itself as an AI Gateway and LLM observability platform. The documentation giveshttps://ai-gateway.helicone.aias the base URL for an OpenAI-compatible client. The repository offers a Docker Compose deployment; according to the README, the production Helm chart is reserved for enterprise customers.
The core difference is where the data lives. LiteLLM keeps its spend rows in your own PostgreSQL database and exposes Prometheus metrics that you collect yourself. Helicone, in the usage described by its documentation, centralises costs and usage in its own dashboard; a self-hosted option exists but was not detailed in the pages read. Check that point before choosing.
Setting up LiteLLM to track costs
Prerequisites
A PostgreSQL database and the DATABASE_URL variable: the virtual keys documentation says they are required to generate keys, and spend tracking relies on the same database. The expected format is postgresql://<user>:<password>@<host>:<port>/<dbname>.
Step 1 — Declare the models and enable metrics
The configuration file lists the exposed models, a master key and the callbacks. The screenshot assembles the examples from the “configs” and “prometheus” documentation pages; the model names come from the documentation and are fictitious.
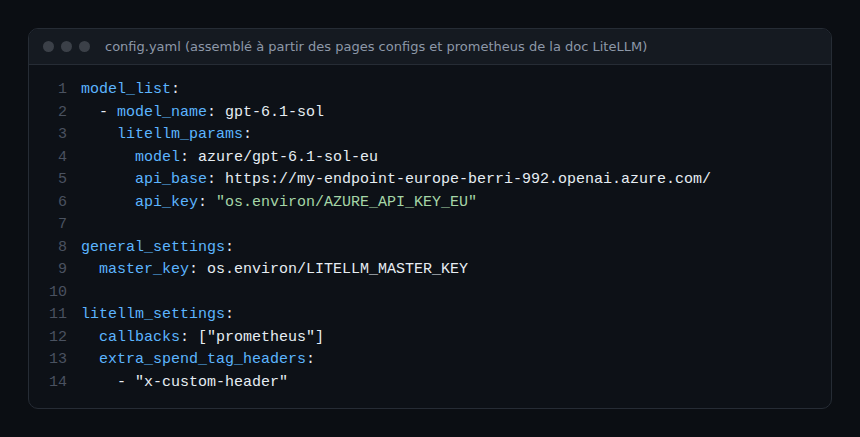
Lines to note:
master_keyreads its value from the environment (os.environ/prefix): no plain-text key in the file.callbacks: ["prometheus"]enables the/metricsendpoint on the proxy port.extra_spend_tag_headersturns a request header (herex-custom-header) into a spend tag, for instance a project identifier.
Start-up, according to the documentation:
export DATABASE_URL="postgresql://user:password@localhost:5432/litellm"
litellm --config /path/to/config.yaml
Step 2 — Create one key per team with a budget
Spend is attributed to the virtual key, then to its user and team. The documentation gives the /key/generate call with the master key in the Authorization header; max_budget and budget_duration appear there as request parameters, but not in a single example:
curl 'http://0.0.0.0:4000/key/generate' \
  --header 'Authorization: Bearer <your-master-key>' \
  --header 'Content-Type: application/json' \
  --data-raw '{"models": ["gpt-6.1-sol"], "max_budget": 10, "budget_duration": "30d", "metadata": {"user": "platform-team"}}'
The values 10 and 30d are examples to adapt, and the model name is the documentation’s. Each application or team gets its own key: that is what makes spend readable. Mind the documentation’s remark: the user parameter of a request is recorded as the end user, but does not change the key owner’s totals. For reliable per-user tracking, set user_id when creating keys.
Step 3 — Tag the requests
Each call writes a row to the LiteLLM_SpendLogs table: hashed key, user, team, tags, model, spend and token counts. Tags can be passed per request through metadata.tags, per key or team at creation, or by header with extra_spend_tag_headers. The response also carries the computed cost in the x-litellm-response-cost header. To read the rows back: GET /spend/logs (with summarize=false for detail) or the paginated GET /spend/logs/v2, whose total the documentation says is capped at 10,000.
How to check that it works
After a few requests, query the metrics endpoint. The documentation states that, since version 1.85.0, /metrics requires a LiteLLM API key by default: add a Bearer authorization block to the Prometheus scrape configuration. The reference page lists, among others:
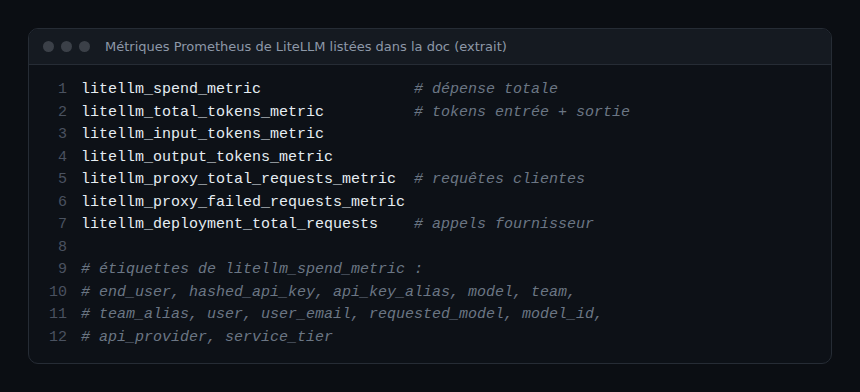
The page says these counters are queried with the _total suffix in PromQL. A useful query for the internal finance team, to validate on your own instance: the sum of litellm_spend_metric_total grouped by team_alias and model, over a 24-hour window. A litellm_zero_cost_requests_total counter also flags requests that consumed tokens without being priced: a model missing from the price table would otherwise skew your totals silently.
The spend metrics are not marked “enterprise” on the page read, unlike the managed batch metrics. The labels (team, api_key_alias, model, user_email…) are numerous: watch your Prometheus cardinality before enabling everything, see OpenTelemetry and Prometheus.
Helicone: tracking through headers
With Helicone, client-side setup boils down to two changes: the base URL and the key. Cost dimensions travel in headers: Helicone-User-Id, reserved for per-user tracking, and Helicone-Property-[Name] for any custom property, such as the environment or the application.
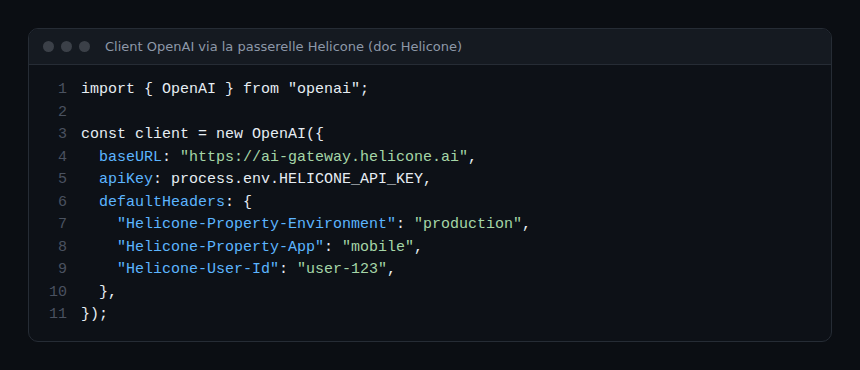
The gateway documentation claims to track usage, costs and performance across all providers in one dashboard, and states a 0% markup on tokens with its credits, against 5.5% for OpenRouter: these figures are the vendor’s, not verified here. A neighbouring page, about the legacy proxy mode (gateway.helicone.ai with the Helicone-Target-Url header), says cost calculation is not supported for several providers, including AWS Bedrock and Cohere. Before adopting either tool, check that your providers and models are covered.
And the OpenTelemetry and Dynatrace side?
The LiteLLM documentation provides an otel callback: callbacks: ["otel"], with environment variables. For an OTLP HTTP collector, the page uses OTEL_EXPORTER_OTLP_ENDPOINT, OTEL_EXPORTER_OTLP_PROTOCOL and OTEL_EXPORTER_OTLP_HEADERS. The page gives no complete configuration: test it before relying on it. gRPC export needs the grpcio package.
On Dynatrace SaaS, the OTLP export documentation gives the base https://{environment-id}.live.dynatrace.com/api/v2/otlp with the paths /v1/traces, /v1/metrics and /v1/logs. It states that gRPC is not supported and that the format is binary Protobuf; it recommends a Collector to convert. The token goes in Authorization=Bearer; the ingest permissions listed by the page belong to the openpipeline:…:ingest family, to be checked in the token documentation for your version. For Managed, that page gives no URL: refer to the Managed documentation. No Dynatrace integration specific to LiteLLM or Helicone was found in the pages read; only OTLP is documented.
The safest path is therefore gateway → OpenTelemetry Collector → Dynatrace. To link tokens and costs to an agent’s traces, see the cost of an AI agent in OpenTelemetry, and for the same control-point role on MCP tools, agentgateway. If detailed prompt tracing matters more than spend, Langfuse and OpenLLMetry address a different need.
Best practices
- One virtual key per application and per team: without it, spend belongs to nobody.
- Set a budget per key from the start, and alert before the ceiling rather than when requests are refused (an exhausted budget cuts a service: it is an availability risk, not only a cost risk).
- Limit metric labels to the ones you need: team and model are often enough.
- Watch zero-cost requests: an unpriced model skews tracking.
- Treat the gateway as a critical component: it becomes a single point of passage, hence of failure. Plan replicas, an alert on the failure rate (
litellm_proxy_failed_requests_metric) and a pinned version. - Do not log prompts without a retention policy: they often contain personal data.
Frequently asked questions
Does an LLM gateway replace application observability?
No. It counts tokens, costs and errors at the model-call level. It says nothing about the rest of the user request: application traces remain necessary to locate latency.
LiteLLM or Helicone to track costs?
According to their documentation, LiteLLM is self-hosted with your PostgreSQL and exposes Prometheus metrics; Helicone is used by changing the URL and headers, with its dashboard. The choice depends on where you want to keep the data and on provider coverage.
Can this data be sent to Dynatrace?
Through OTLP only, according to the pages read, and not over direct gRPC: go through a Collector that converts to OTLP/HTTP. No dedicated connector is documented.
Conclusion
An LLM gateway finally gives model costs a “team” and “application” dimension, provided you create distinct keys, tag requests and check how tokens are priced. LiteLLM fits naturally into a Prometheus stack, Helicone is quicker to plug in but moves the data. Sources: LiteLLM Prometheus metrics, LiteLLM spend tracking, Helicone gateway and OTLP export to Dynatrace.
span.observer is an independent community blog, not affiliated with Dynatrace LLC, BerriAI or Helicone. Trademarks belong to their owners. Tools evolve quickly: check commands and options in their official documentation.